
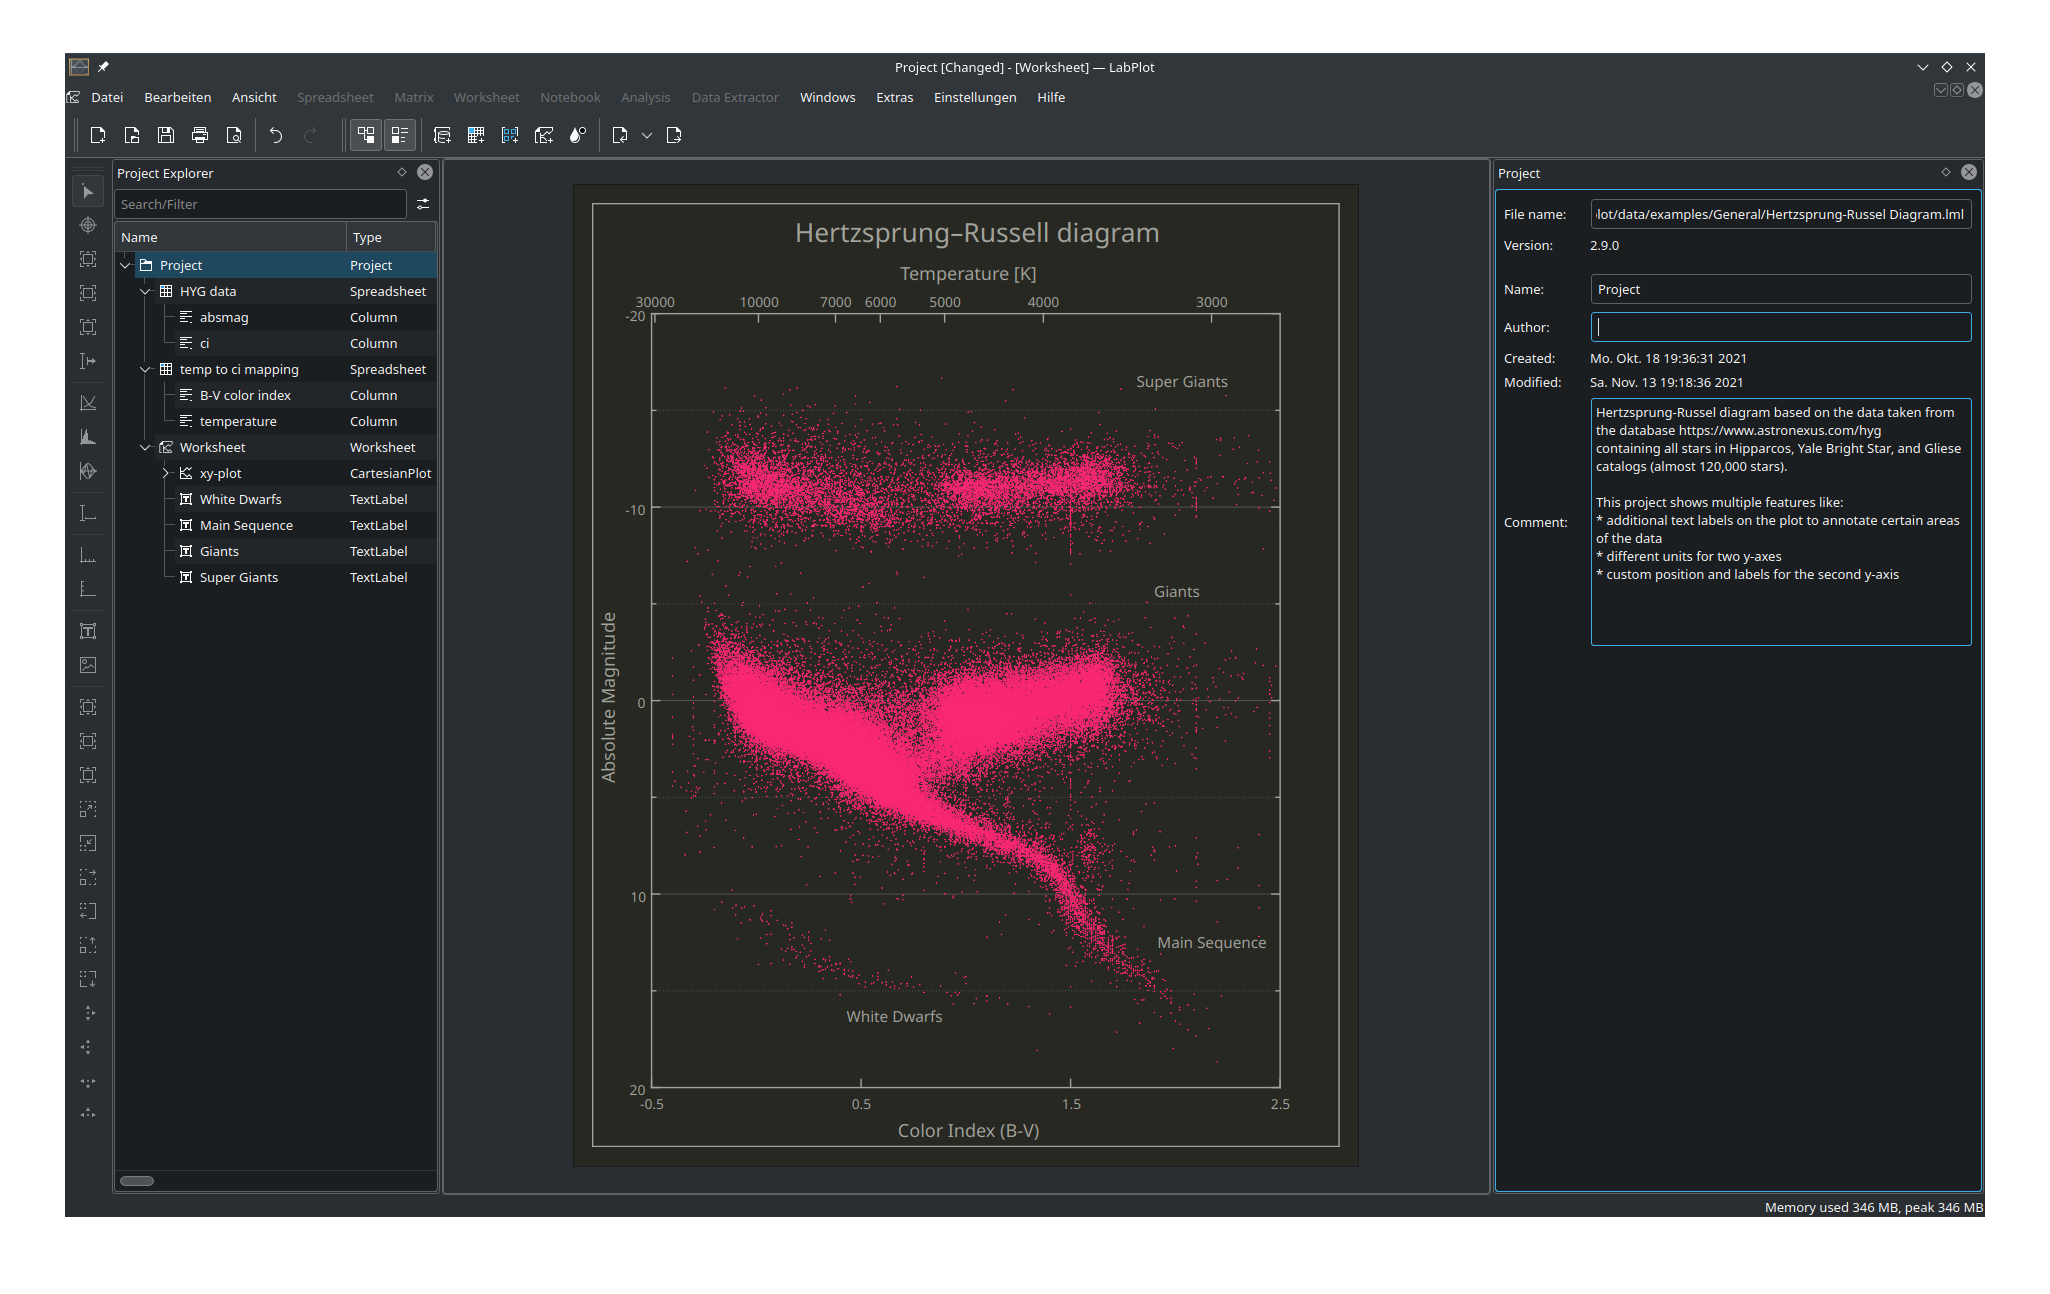
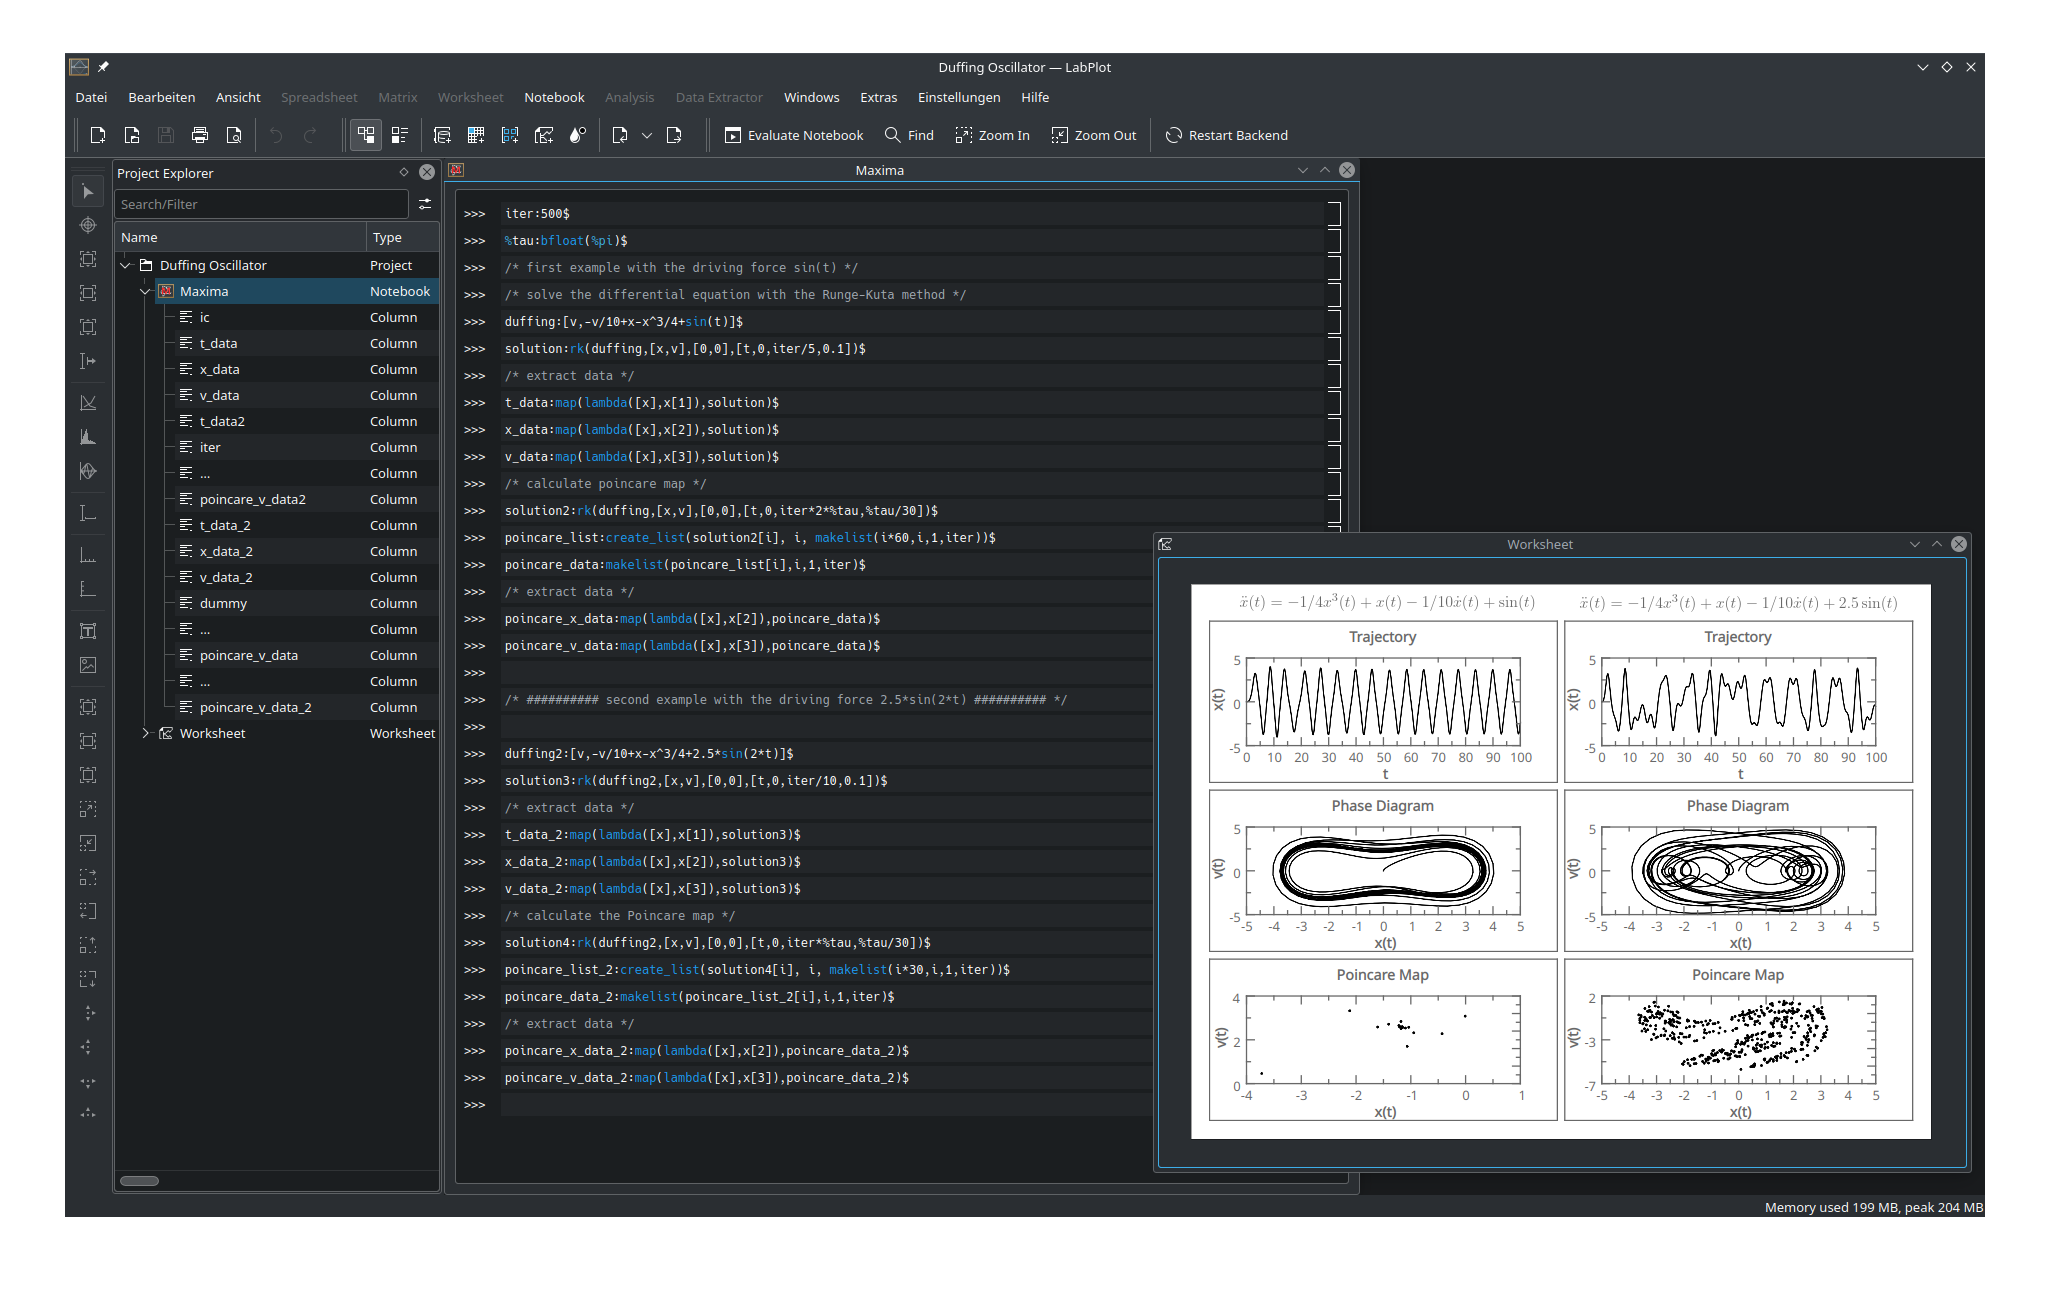
LabPlot is a FREE, open source and cross-platform Data Visualization and Analysis software accessible to everyone.
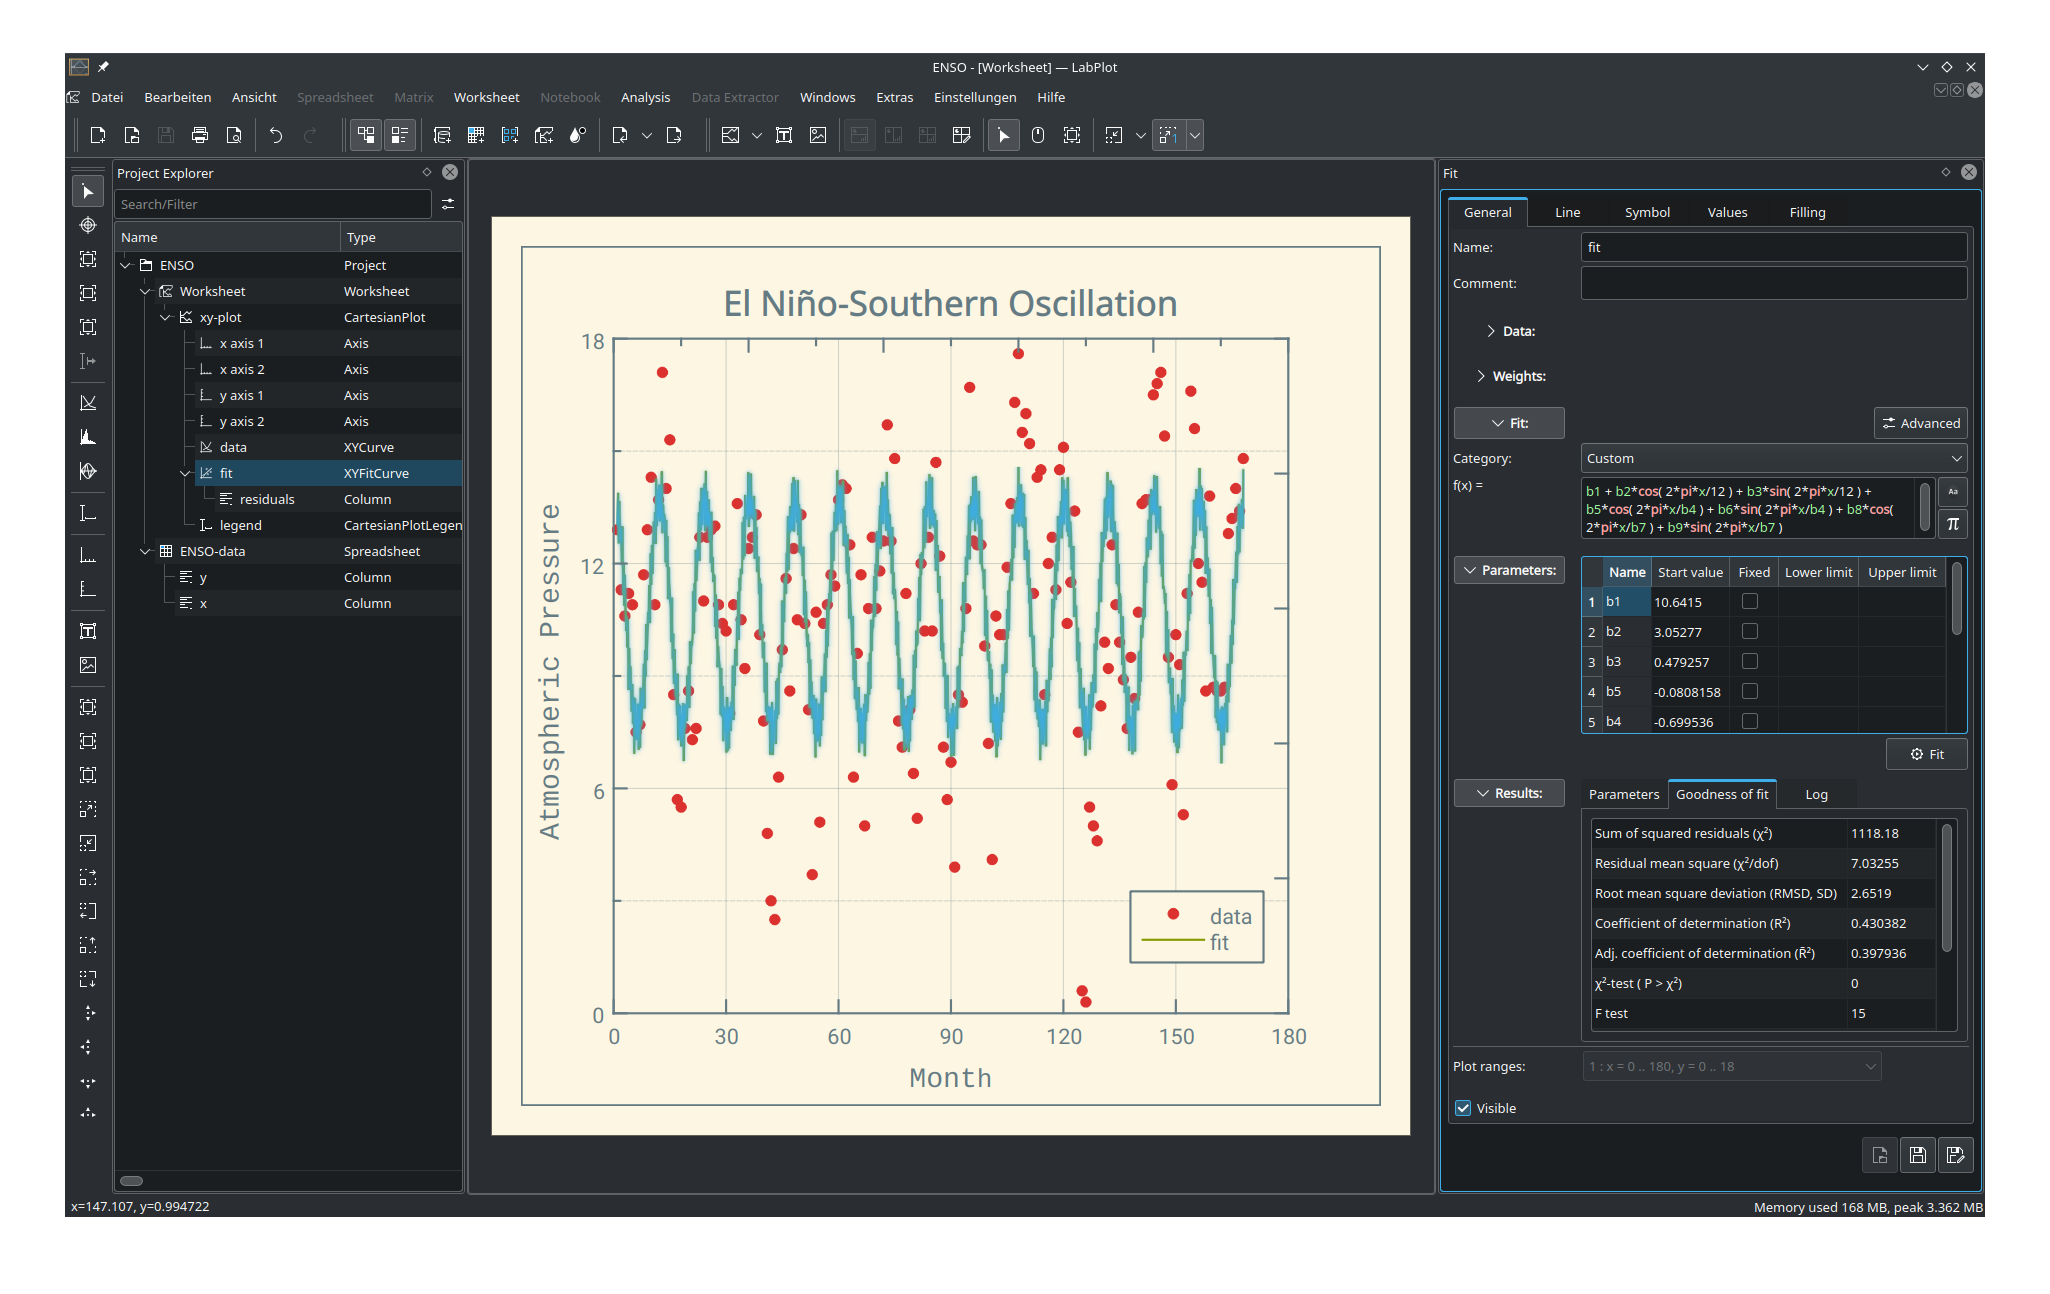
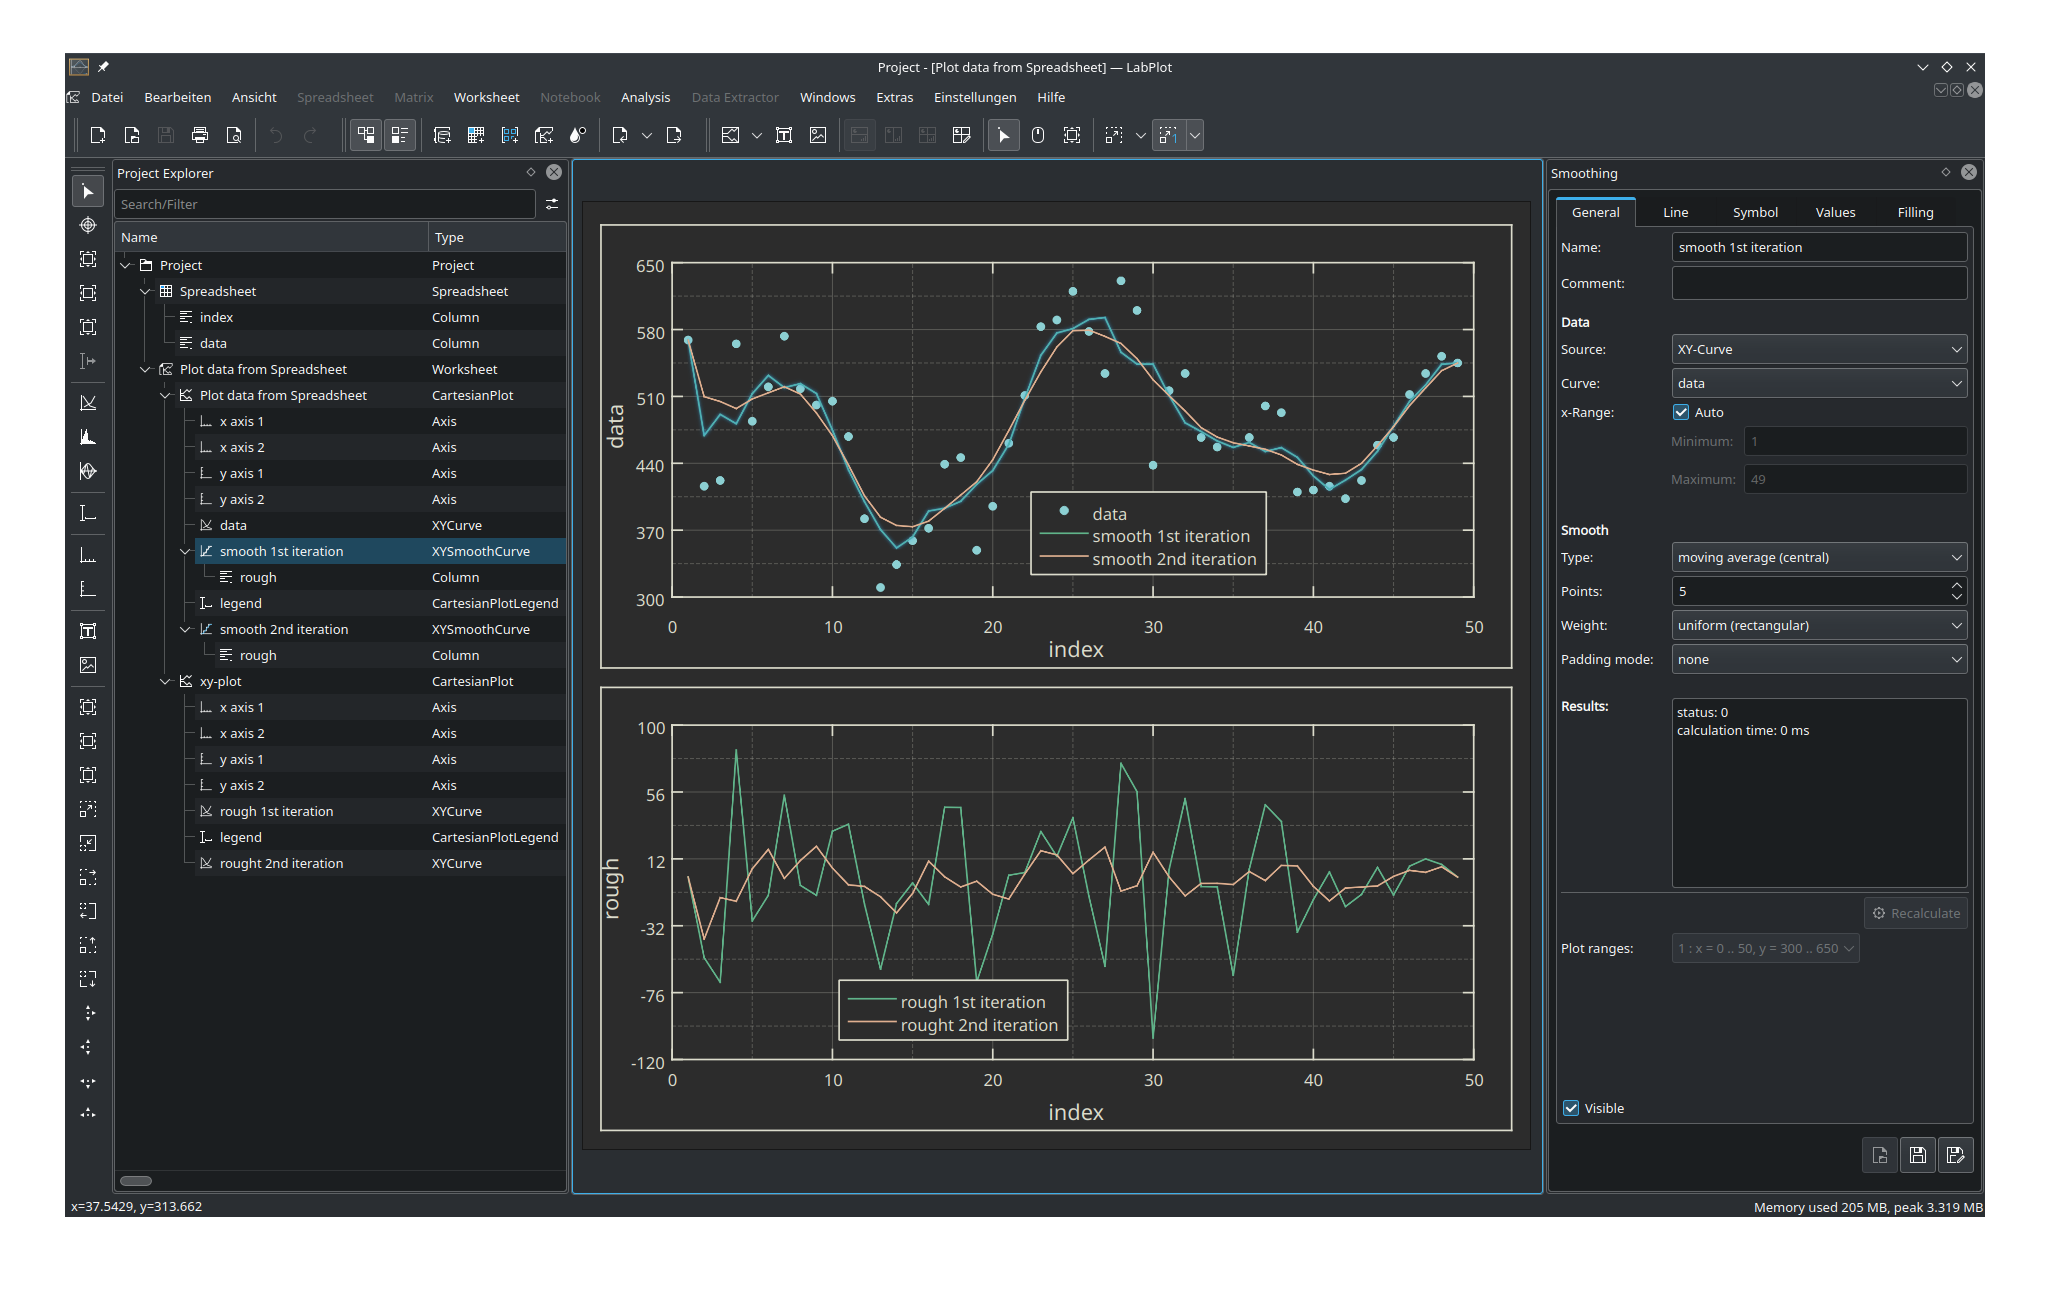
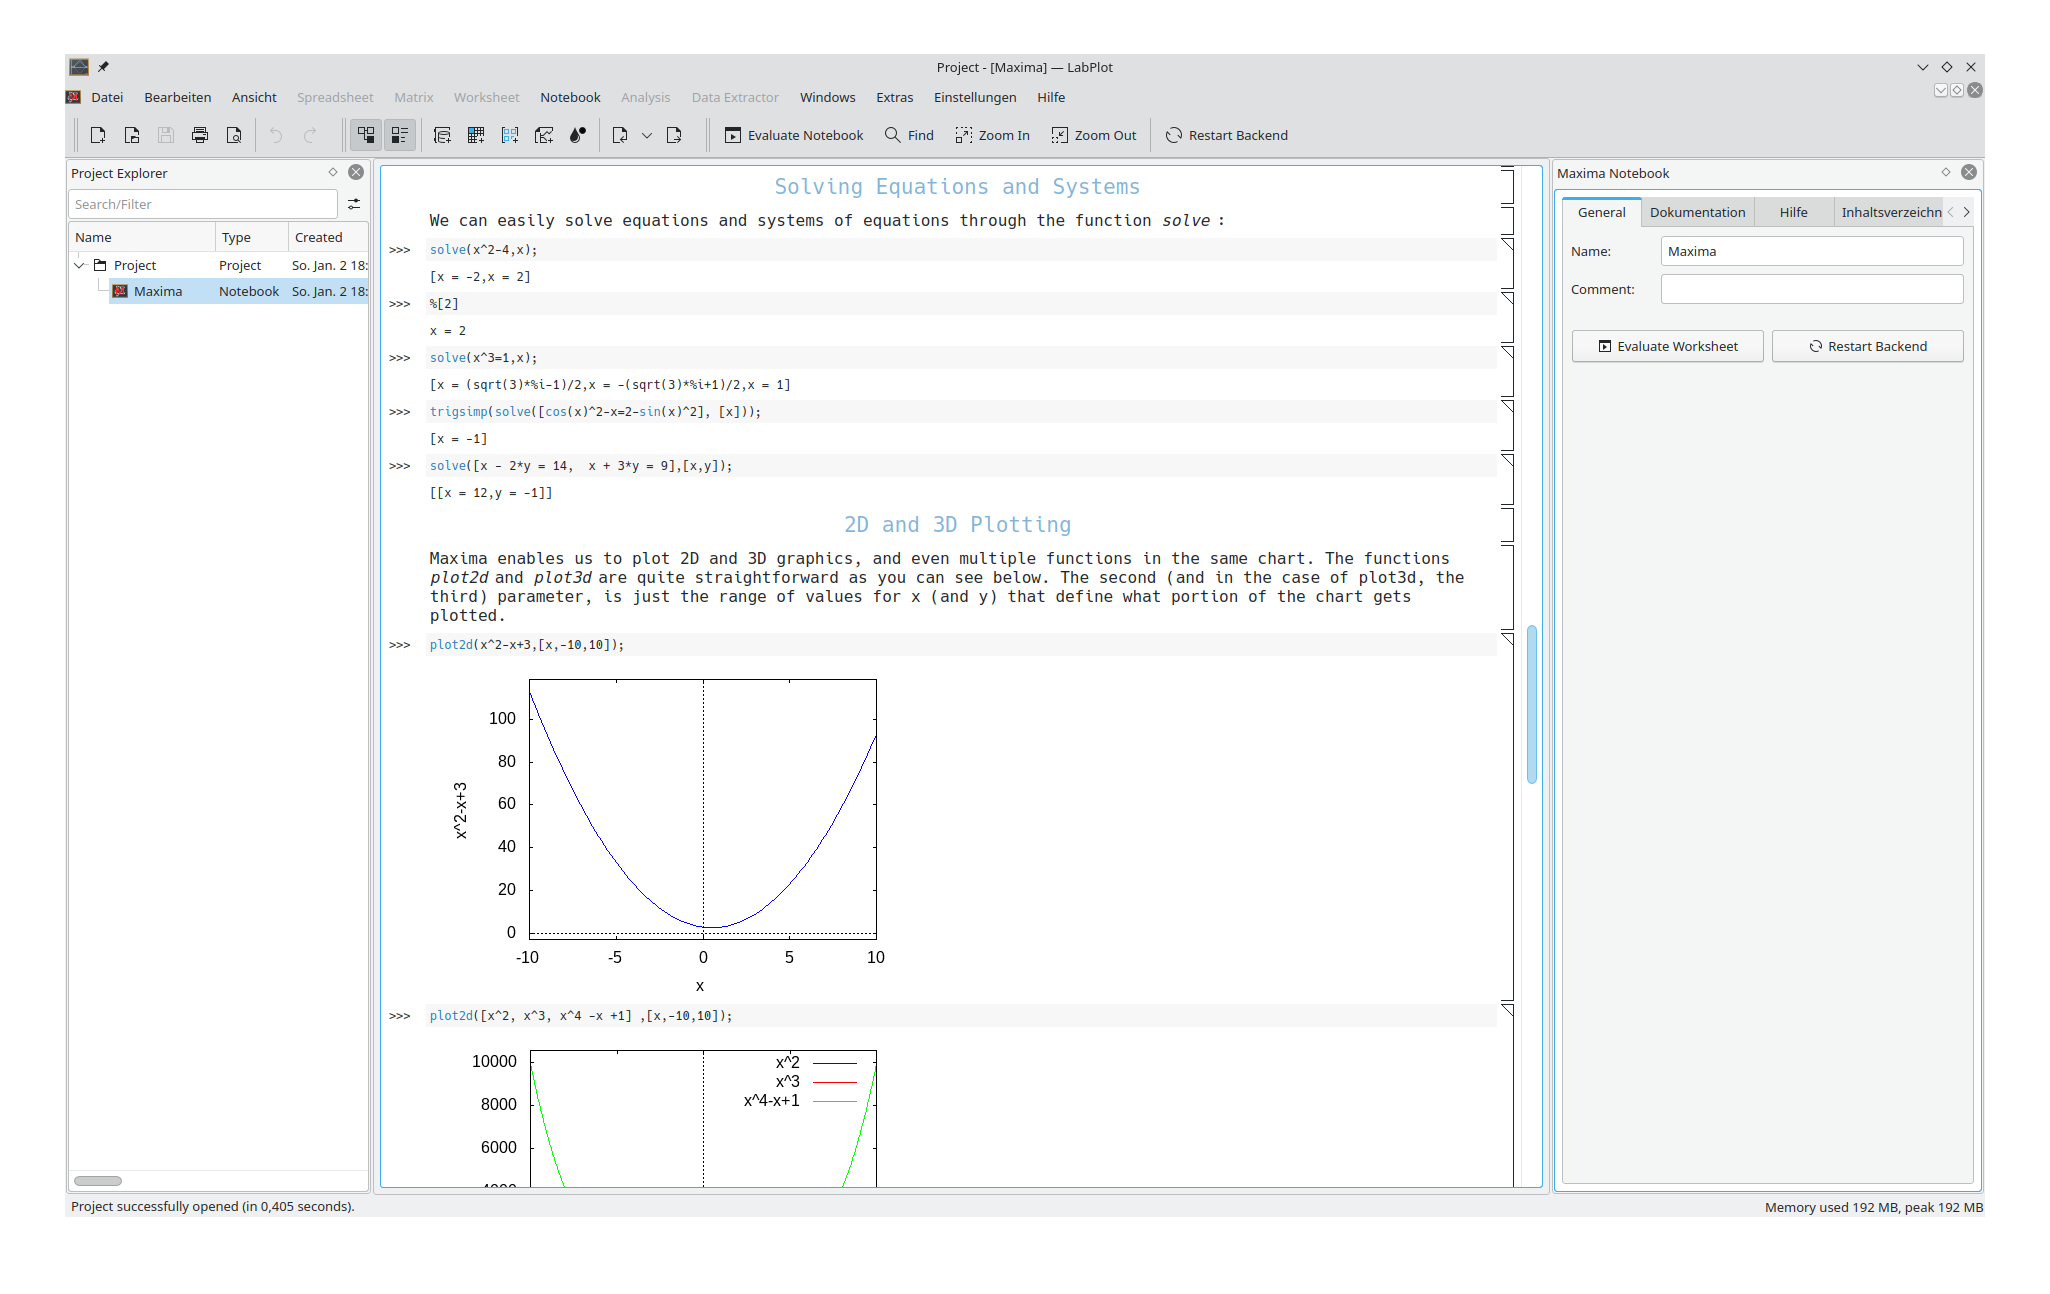
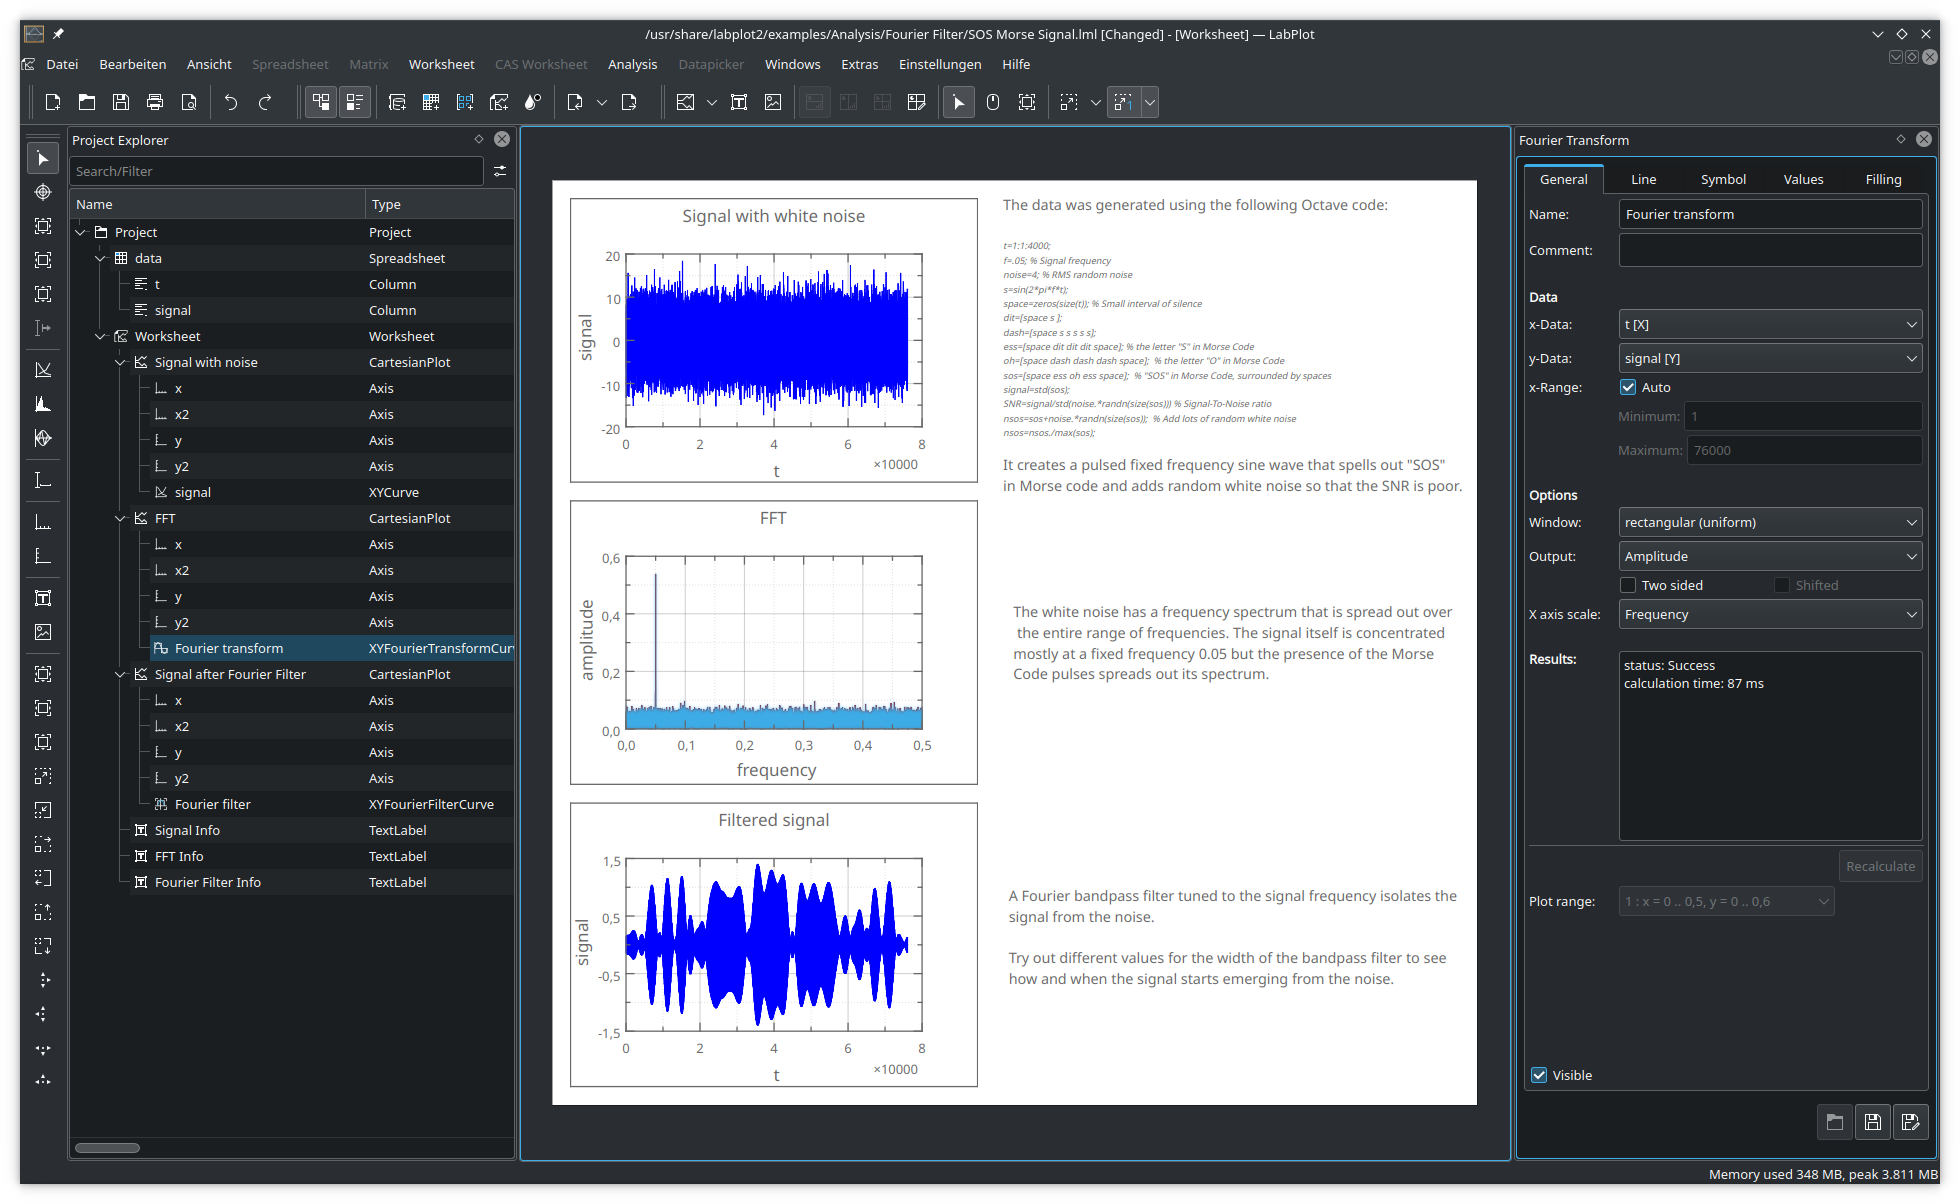
LabPlot provides an easy way to create, manage and edit plots. It allows you to produce plots based on data from a spreadsheet or on data imported from external files. Plots can be exported to several pixmap and vector graphic formats.

Install on
Linux


Buraxılışlar RSS
2.12.1
2025-08-15
2.12.0
2025-04-25
2.11.1
2024-07-16
2.11.0
2024-07-09
2.10.1
2023-07-11
2.10.0
2023-03-21
2.9.0
2022-05-03
2.8.2
2021-04-01
2.8.1
2020-11-13
2.8.0
2020-09-16
Nightly installers
LabPlot nightly installers are also available to download from the KDE CDN. These versions are intended for testing purpose. Get involved and help us make them better!
Qeyri-stabil versiya.
Tərtibat mərhələsi şöbəsinin sonucu versiyasından yaradılıb.