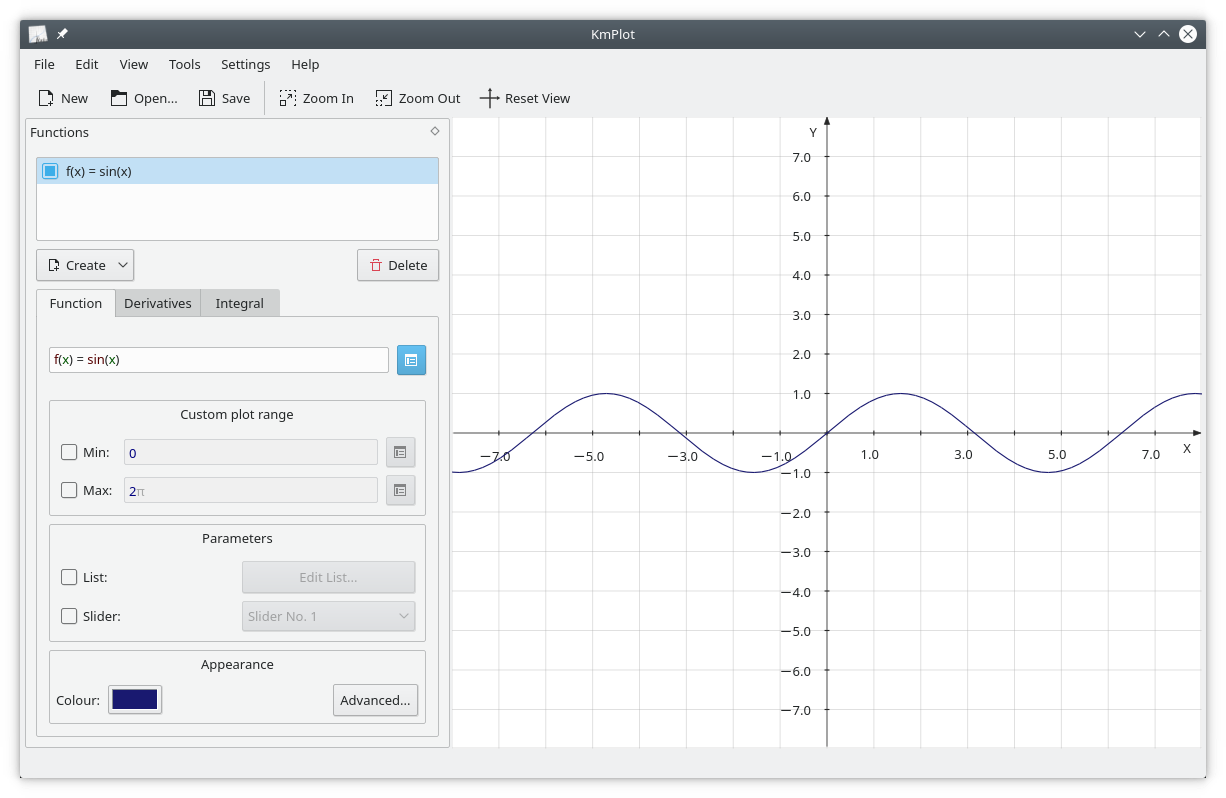
KmPlot je program pro vykreslování grafů funkcí, jejich integrálů nebo derivací. Grafy lze barevně odlišit a zobrazení je vysoce přizpůsobitelné, škálovatelné a lze jej přibližovat. Program disponuje výkonným matematickým parserem, různými typy grafů (kartézské, parametrické, polární, implicitní, diferenciální) a poskytuje jednoduché matematické nástroje, jako je například hledání maxima/minima funkce. Parametrizované funkce lze vizualizovat úpravou proměnné pomocí posuvníku. Grafy lze exportovat jako obrázky ve formátu bitmapy (BMP, PNG) a lze je tisknout.

Nainstalovat na
Linux


Vydání RSS
1.3.26042
2026-06-04
1.3.26041
2026-05-07
1.3.26040
2026-04-16
1.3.25123
2026-03-05
1.3.25122
2026-02-05
1.3.25121
2026-01-08
1.3.25120
2025-12-11
1.3.25083
2025-11-06
1.3.25082
2025-10-09
1.3.25081
2025-09-11
1.3.25080
2025-08-14
1.3.25043
2025-07-03
1.3.25042
2025-06-05
1.3.25041
2025-05-08
1.3.25040
2025-04-17
1.3.24123
2025-03-06
1.3.24122
2025-02-06
1.3.24121
2025-01-09
1.3.24120
2024-12-12
1.3.24083
2024-11-07
1.3.24082
2024-10-10
1.3.24081
2024-09-12
1.3.24080
2024-08-22
1.3.24052
2024-07-04
1.3.24051
2024-06-13
1.3.24050
2024-05-23
1.3.24022
2024-04-11
1.3.24021
2024-03-21
1.3.24020
2024-02-28
1.3.23085
2024-02-15
Noční instalátory
Noční instalační soubory KmPlot jsou také k dispozici ke stažení z KDE CDN. Tyto verze jsou určeny pro testovací účely. Zapojte se a pomozte nám je vylepšit!
Nestabilní verze.
Generováno z poslední verze vývojové větve.