KCachegrind
Kategoriak: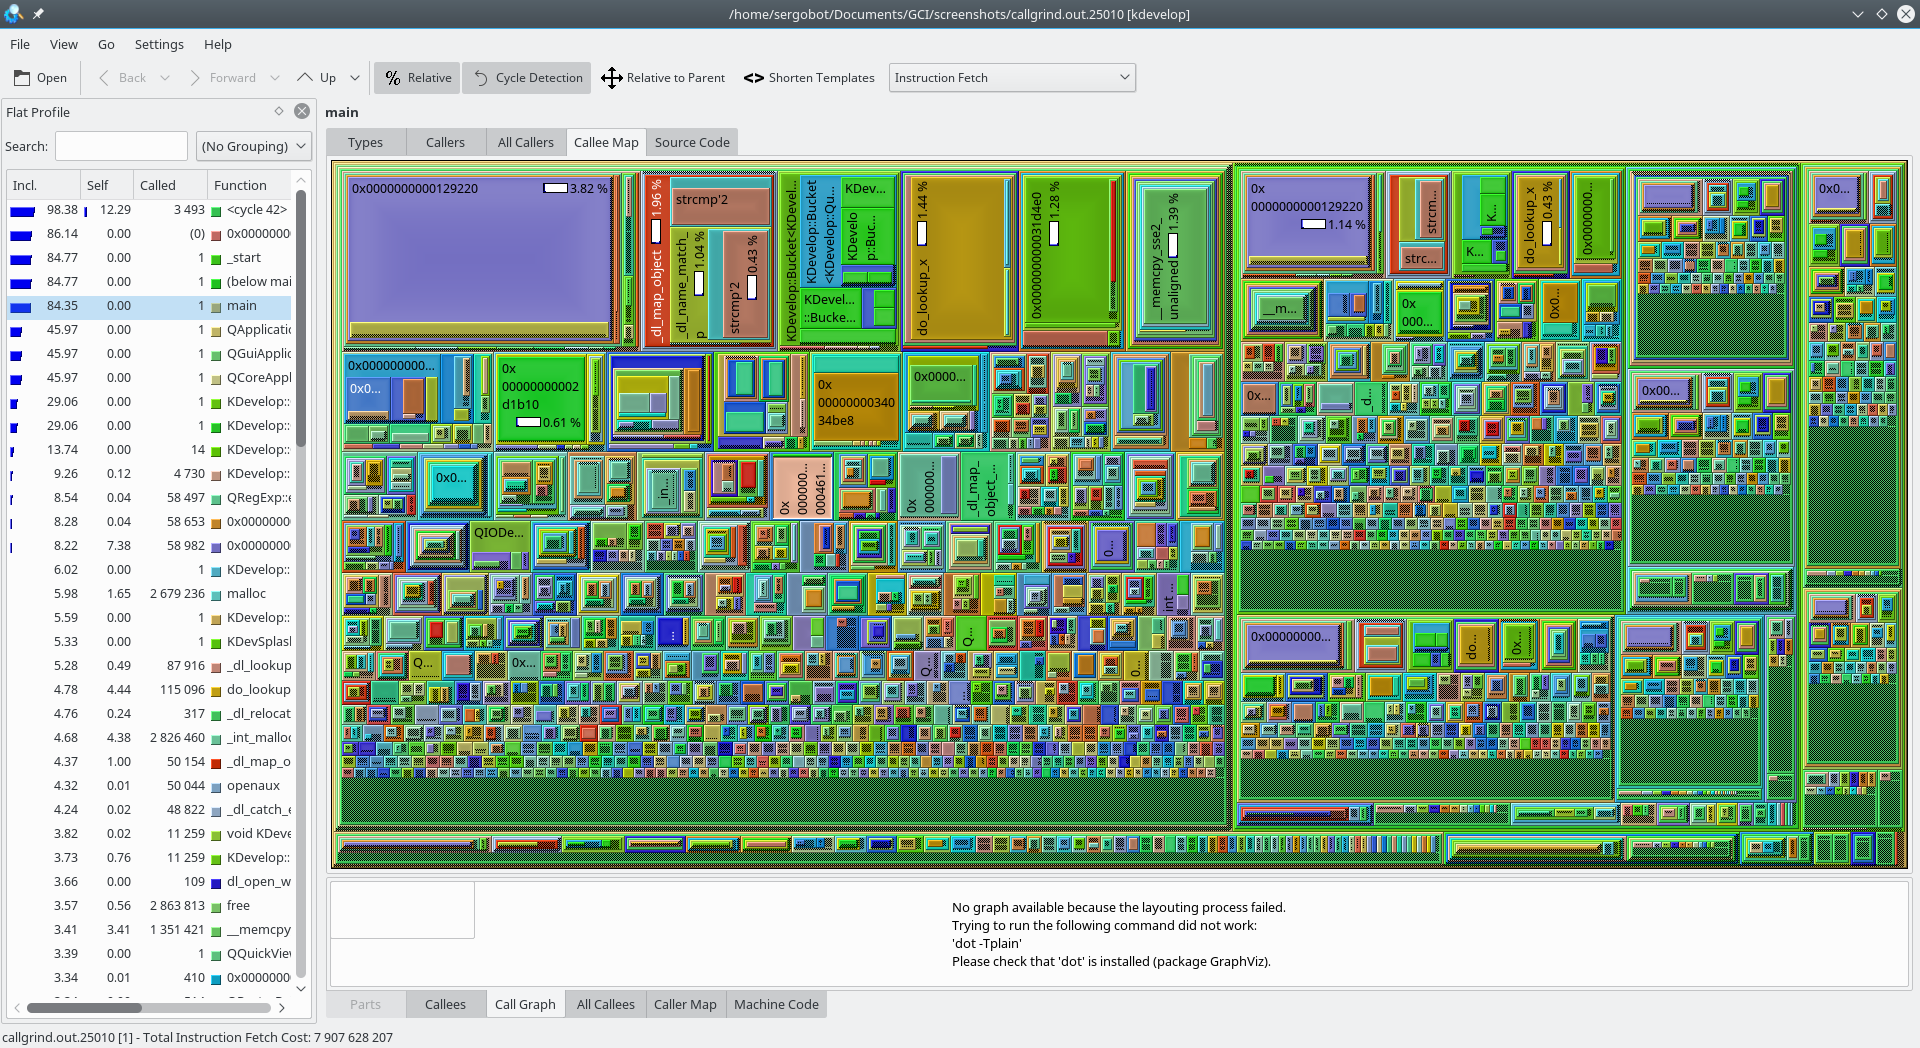
«KCachegrind», profil datuak irudikatzeko tresna bat da, programa baten exekuzioan denbora gehien behar duten atalak zehazteko erabilia.
Ezaugarriak:
- «KCachegrind»ek aplikazioen profilak (hots, exekuzio aldiko ezaugarriak) hainbat eratan irudikatzen ditu, deien irudikapen grafikoak eta sorburu/desmihiztatzaile idatzoharrak barne.
- «Calltree», «Valgrind»eko cache simulazio/dei aztarnari tresnak sortutako profilak zama ditzake. Hortaz, profilatzeak ez du prestaketarik behar, liburutegi partekatuekin eta plugin arkitekturekin moldatzen da, eta ez dio neurketari berari eragiten.
- OProfile, Perl, eta PHP bihurtzeko gidoiak.
- Irudikapen antolaera anizkoitzen artean aldatzea.
- Deien grafikoa irudi gisa esportatu daiteke (PNG).
- Dei eta idatzohar ikuspegietan 2 gertakari aldi berean azaltzea

Non instalatu,
Linux


Argitalpenak RSS
26.04.3
2026-07-02
26.04.2
2026-06-04
26.04.1
2026-05-07
26.04.0
2026-04-16
25.12.3
2026-03-05
25.12.2
2026-02-05
25.12.1
2026-01-08
25.12.0
2025-12-11
25.08.3
2025-11-06
25.08.2
2025-10-09
25.08.1
2025-09-11
25.08.0
2025-08-14
25.04.3
2025-07-03
25.04.2
2025-06-05
25.04.1
2025-05-08
25.04.0
2025-04-17
24.12.3
2025-03-06
24.12.2
2025-02-06
24.12.1
2025-01-09
24.12.0
2024-12-12
24.08.3
2024-11-07
24.08.2
2024-10-10
24.08.1
2024-09-12
24.08.0
2024-08-22
24.05.2
2024-07-04
24.05.1
2024-06-13
24.05.0
2024-05-23
24.02.2
2024-04-11
24.02.1
2024-03-21
24.02.0
2024-02-28
23.08.5
2024-02-15