KCachegrind
Luokat: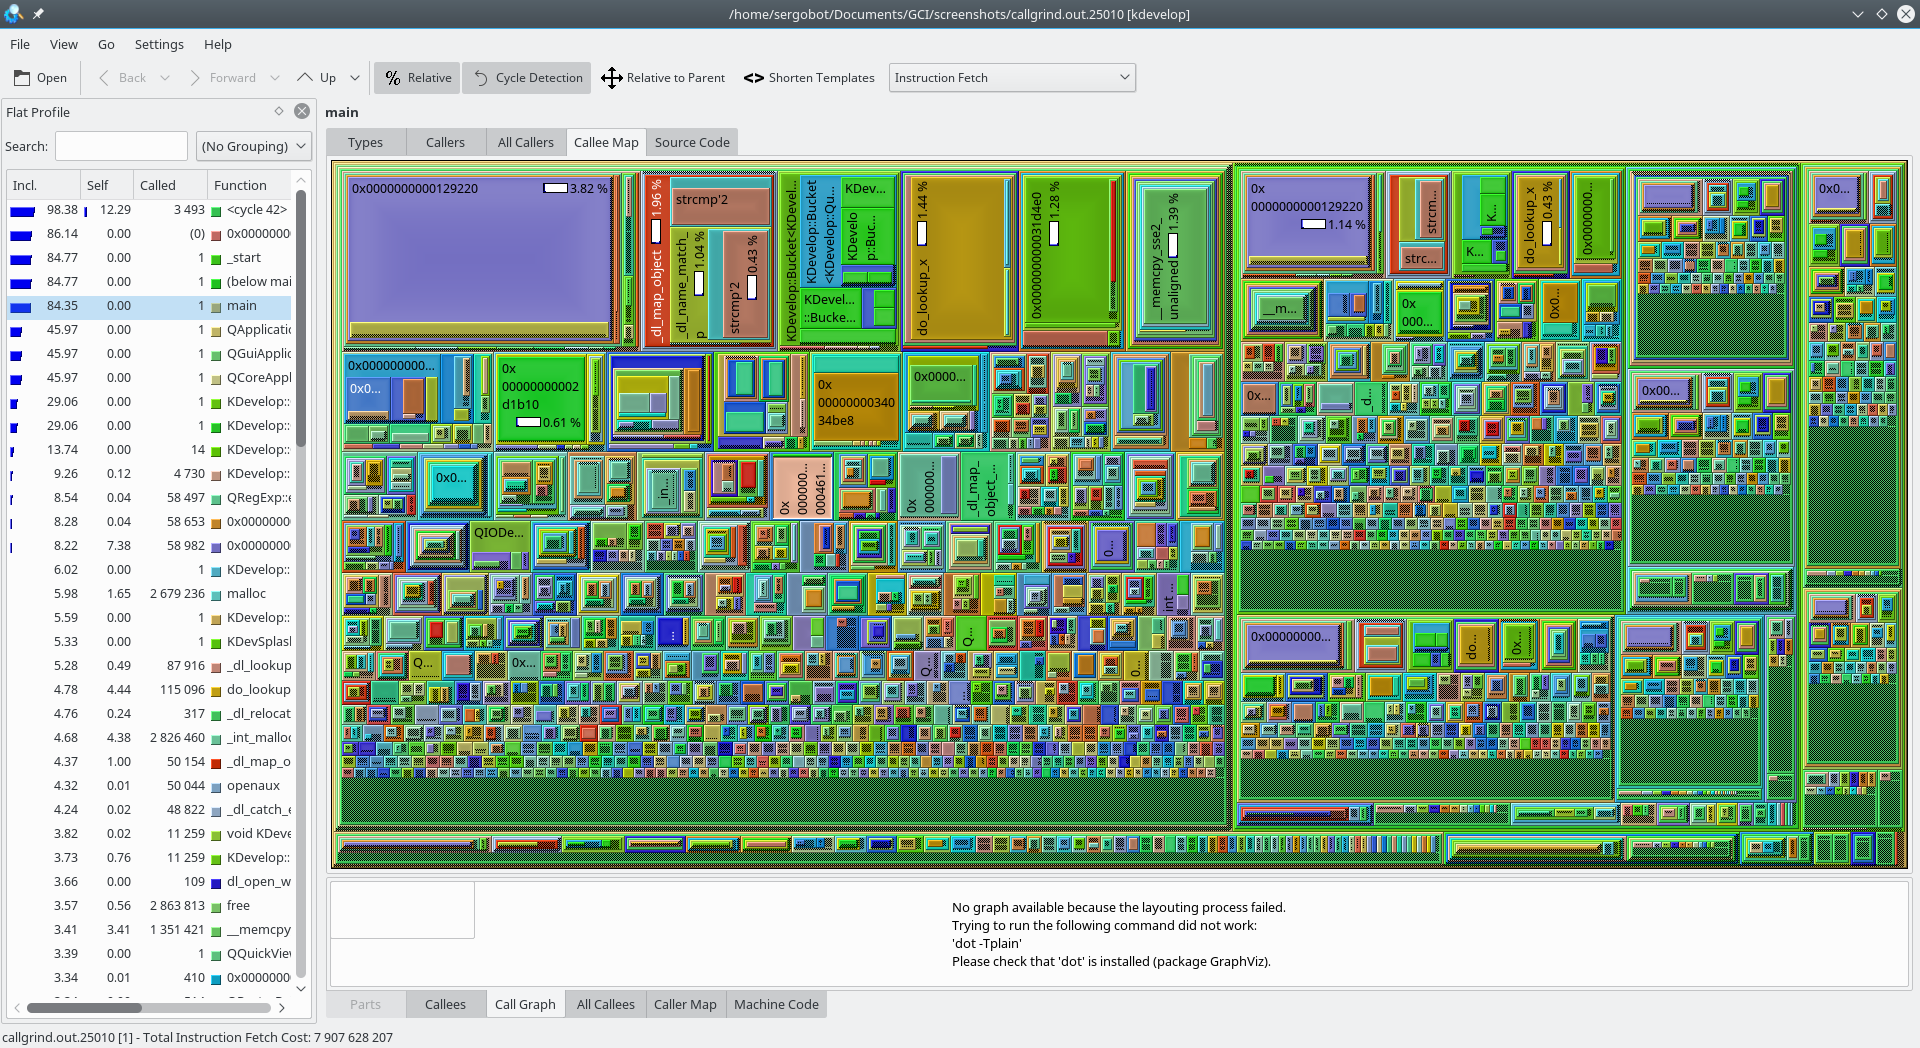
KCachegrind on profiilitiedon visualisointityökalu, joka on tarkoitettu helpottamaan ohjelman suorituksen aikaa vievimpien osien tunnistamisessa.
Ominaisuuksia:
- KCachegrind visualisoi sovellusprofiileja (esim. ajonaikaisominaisuuksia) eri tavoin kuten kutsukaaviovisualisoinnein ja lähde/disassembler-merkinnöin.
- Se osaa ladata välimuistisimulointi- ja kutsujäljitin Calltree (Valgrind-työkalu) tuottamia profiileja, joten profilointi ei vaadi valmistelua, jaetut kirjastot ja liitännäisarkkitehtuurit riittävät, eikä profilointi vaikuta mittaustuloksiin.
- Muunnosskriptit OProfileen, Perliin ja PHP:hen.
- Vaihto useampien visualisointiasettelujen välillä.
- Kutsukaavion voi viedä kuvaksi (PNG).
- Kahden tapahtumatyypin samanaikainen näyttö kutsu- ja merkintänäkymissä

Install on
Linux


Julkaisut RSS
26.04.3
2026-07-02
26.04.2
2026-06-04
26.04.1
2026-05-07
26.04.0
2026-04-16
25.12.3
2026-03-05
25.12.2
2026-02-05
25.12.1
2026-01-08
25.12.0
2025-12-11
25.08.3
2025-11-06
25.08.2
2025-10-09
25.08.1
2025-09-11
25.08.0
2025-08-14
25.04.3
2025-07-03
25.04.2
2025-06-05
25.04.1
2025-05-08
25.04.0
2025-04-17
24.12.3
2025-03-06
24.12.2
2025-02-06
24.12.1
2025-01-09
24.12.0
2024-12-12
24.08.3
2024-11-07
24.08.2
2024-10-10
24.08.1
2024-09-12
24.08.0
2024-08-22
24.05.2
2024-07-04
24.05.1
2024-06-13
24.05.0
2024-05-23
24.02.2
2024-04-11
24.02.1
2024-03-21
24.02.0
2024-02-28
23.08.5
2024-02-15