Heaptrack
Categories: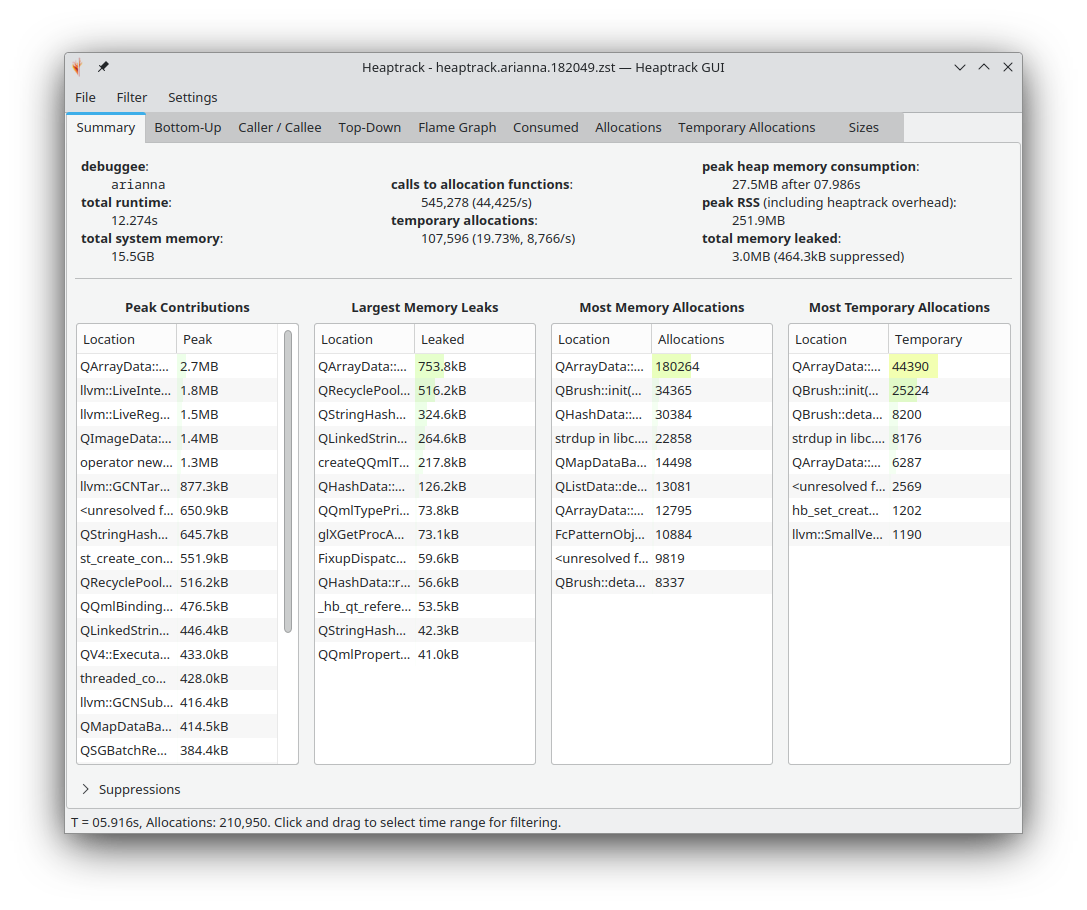
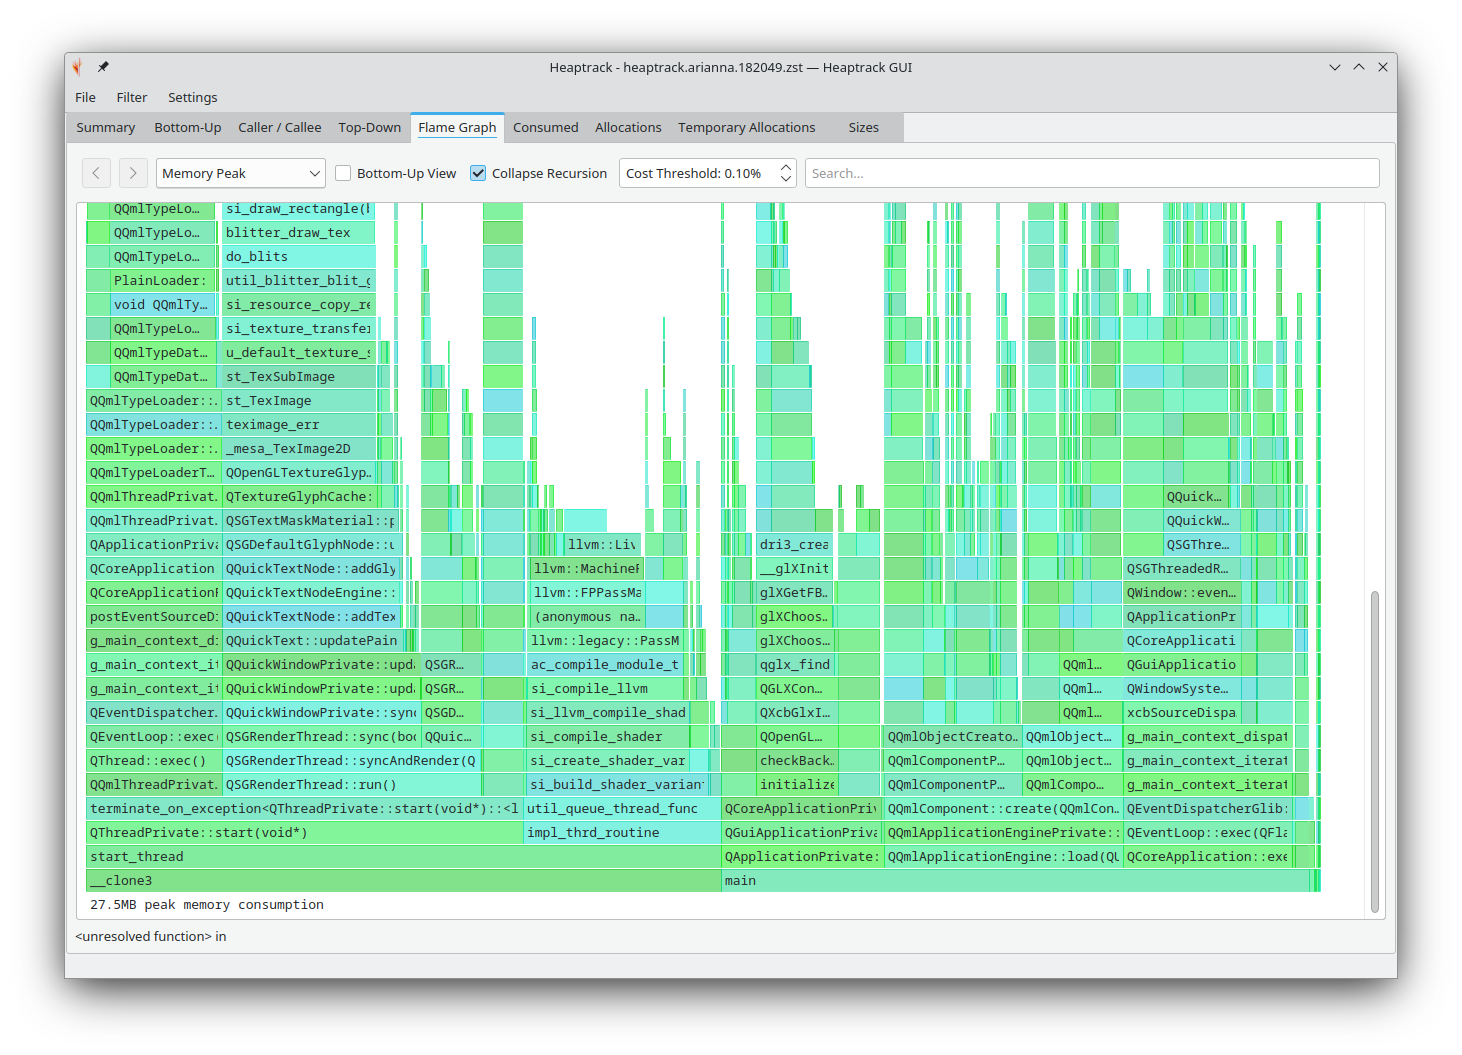

Heaptrack traces all memory allocations and annotates these events with stack traces. Dedicated analysis tools then allow you to interpret the heap memory profile to:
- find hotspots that need to be optimized to reduce the memory footprint of your application
- find memory leaks, i.e. locations that allocate memory which is never deallocated
- find allocation hotspots, i.e. code locations that trigger a lot of memory allocation calls
- find temporary allocations, which are allocations that are directly followed by their deallocation

Install on
Linux
Releases RSS
1.5.0
2023-09-23
1.4.0
2022-06-15
1.3.0
2021-12-16