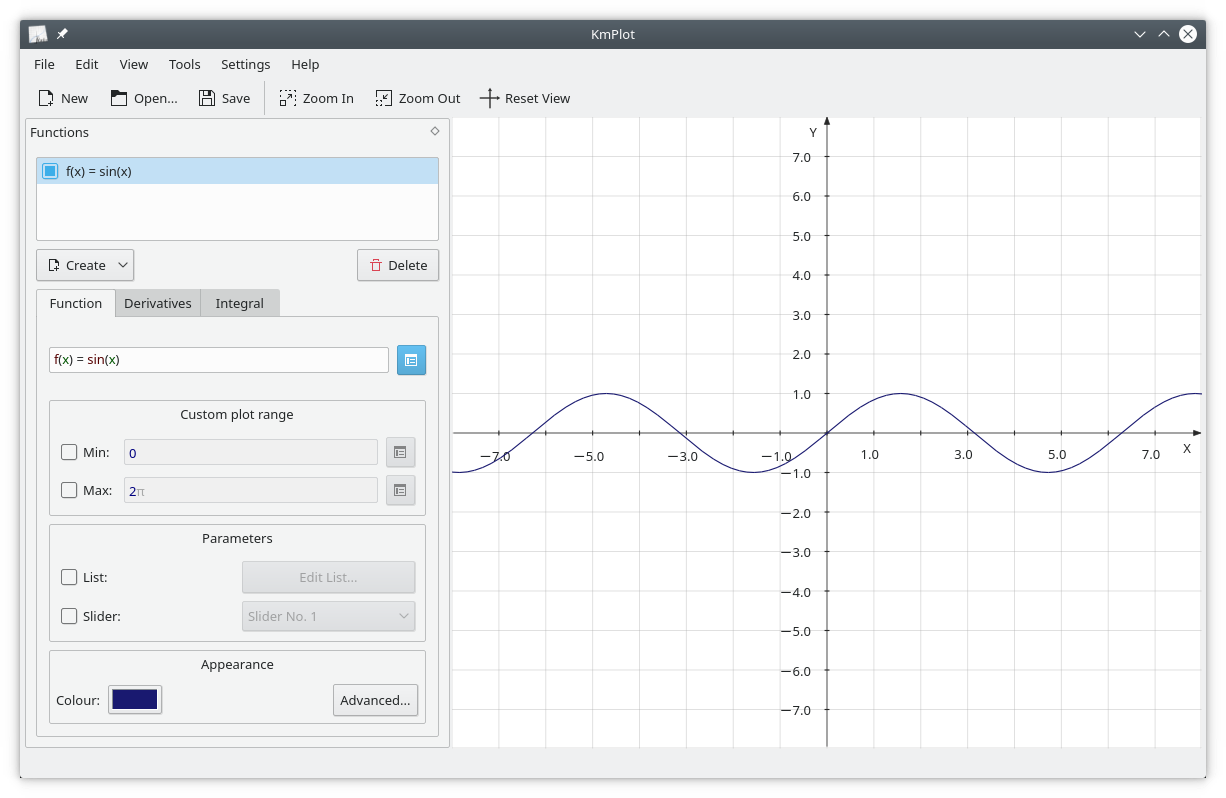
KmPlot is a program to plot graphs of functions, their integrals or derivatives. The graphs can be colorized and the view is highly configurable, is scalable, and can be zoomed. The program features a powerful mathematical parser, different plot types (cartesian, parametric, polar, implicit, differential), and provides simple mathematical tools like for finding maximum/minimum of a function. Parametrized functions can be visualized by adjusting the variable parameter via a slider. Plots can be exported as bitmap format pictures (BMP, PNG) and can be printed.
Telepítés
Linuxon
Kiadások RSS
1.3.25042
2025-06-05
1.3.25041
2025-05-08
1.3.25040
2025-04-17
1.3.24123
2025-03-06
1.3.24122
2025-02-06
1.3.24121
2025-01-09
1.3.24120
2024-12-12
1.3.24083
2024-11-07
1.3.24082
2024-10-10
1.3.24081
2024-09-12
1.3.24080
2024-08-22
1.3.24052
2024-07-04
1.3.24051
2024-06-13
1.3.24050
2024-05-23
1.3.24022
2024-04-11
1.3.24021
2024-03-21
1.3.24020
2024-02-28
1.3.23085
2024-02-15
Nightly installers
KmPlot nightly installers are also available to download from the KDE CDN. These versions are intended for testing purpose. Get involved and help us make them better!
Instabil verzió.
A fejlesztői ág legfrissebb verziójából van előállítva.