
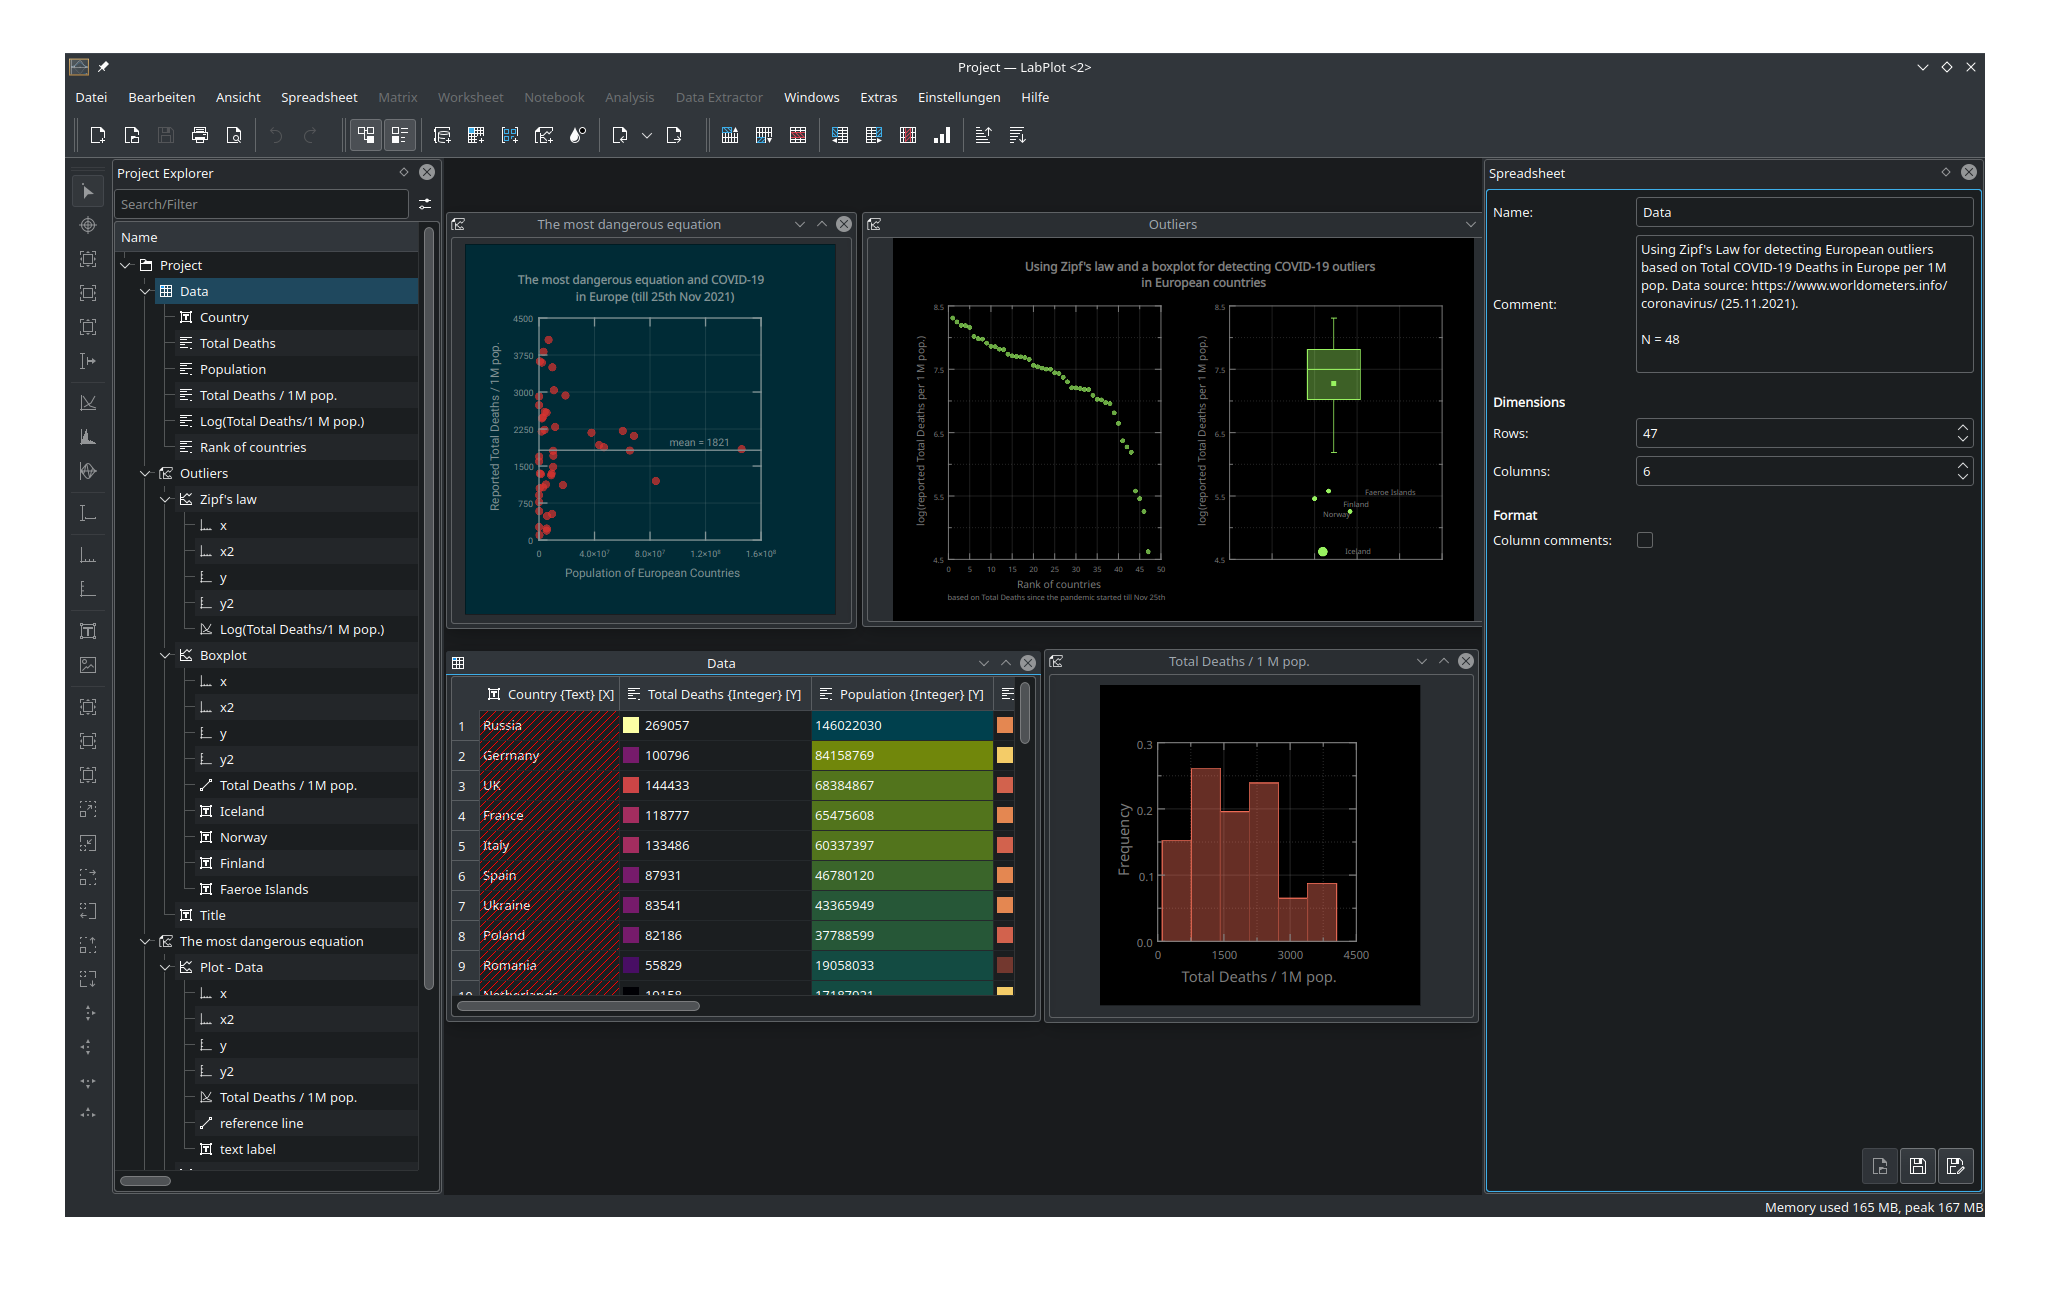
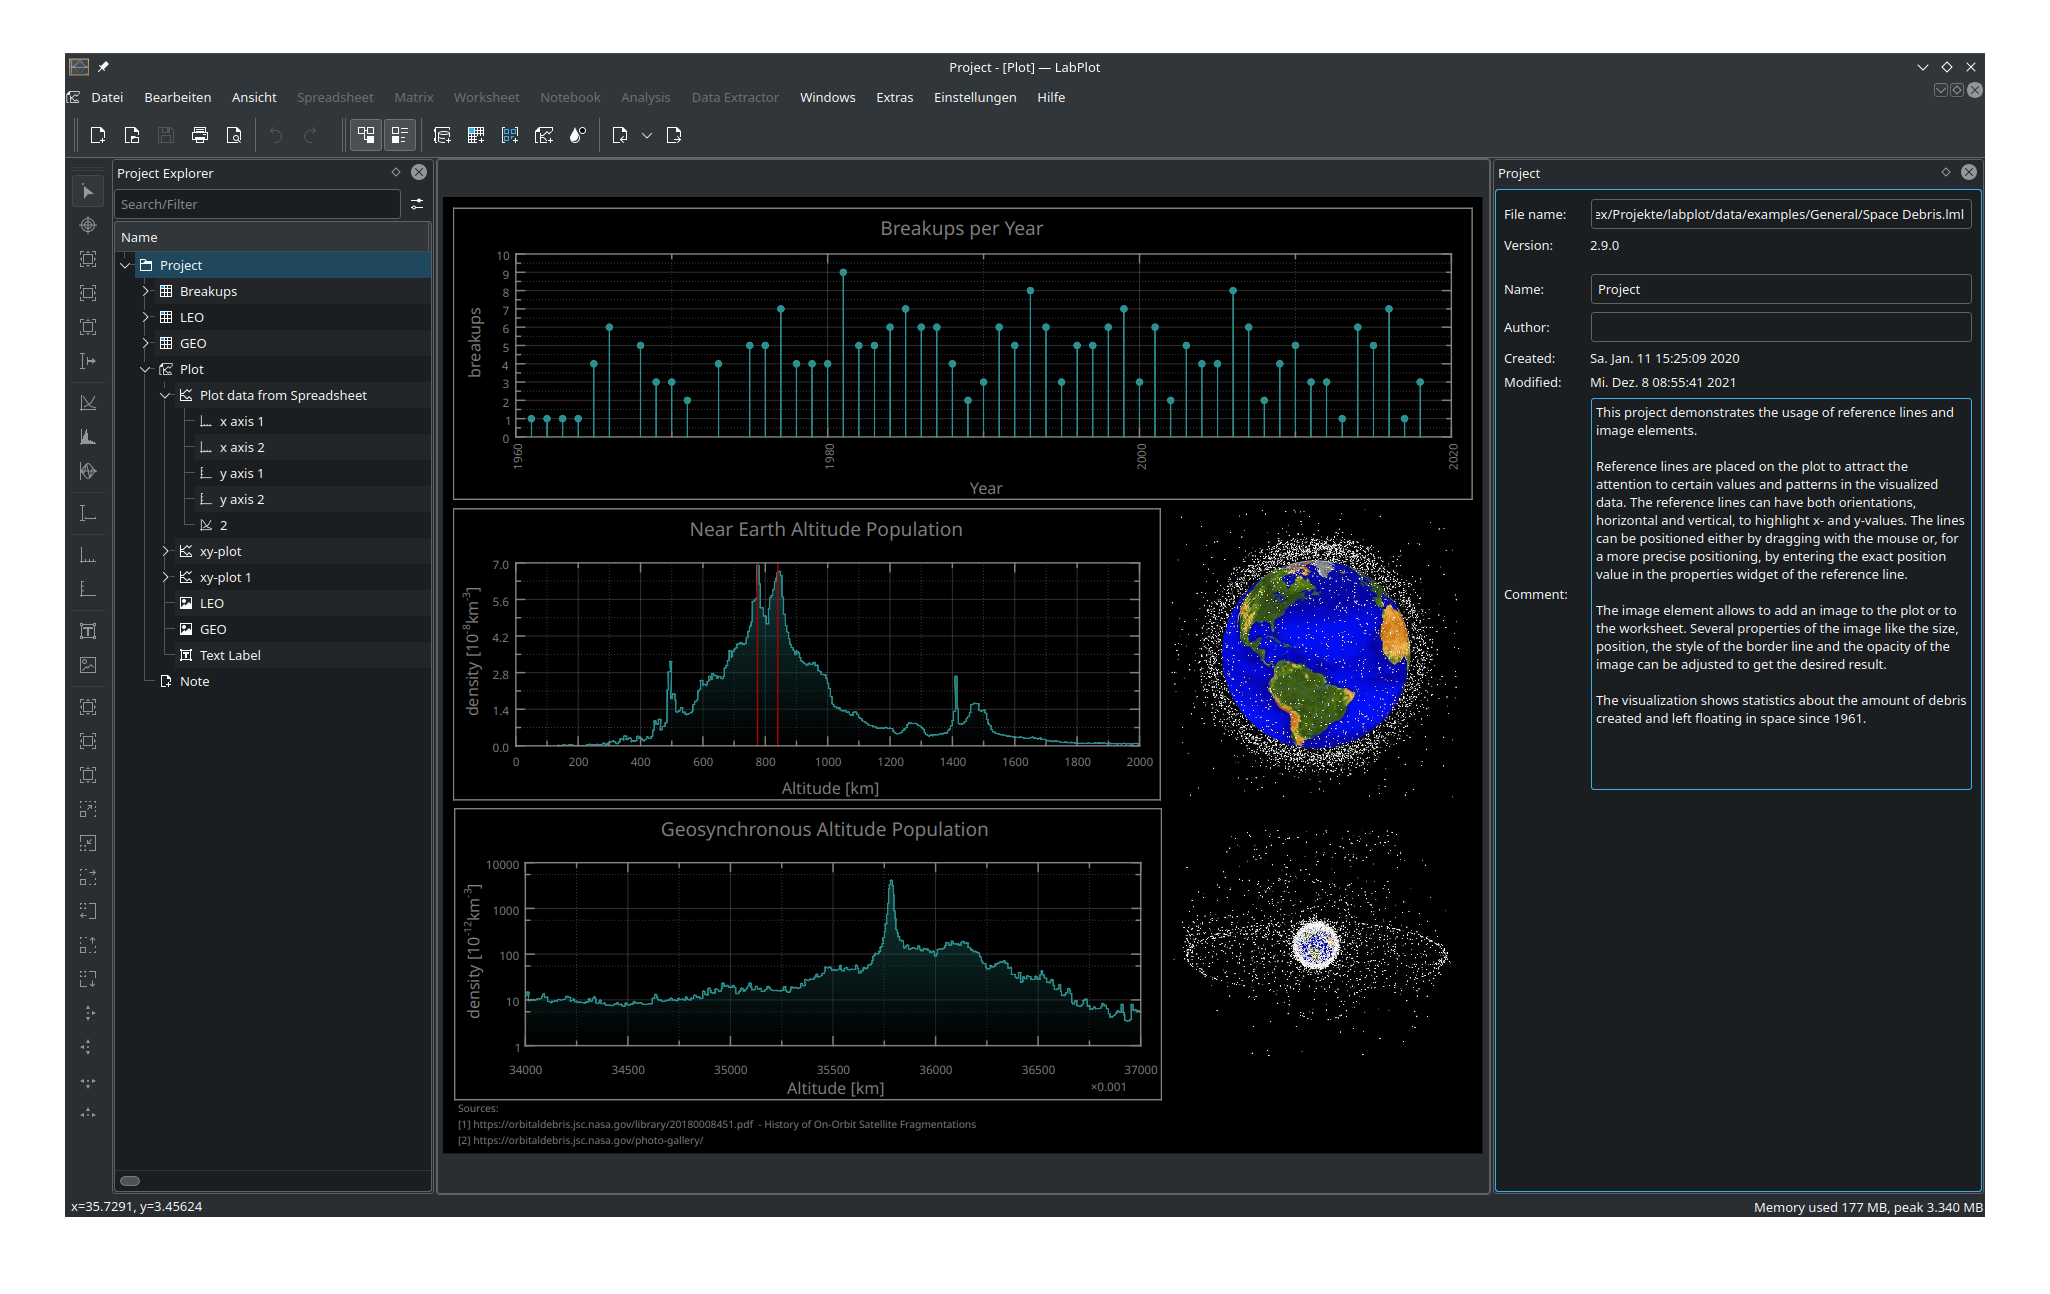
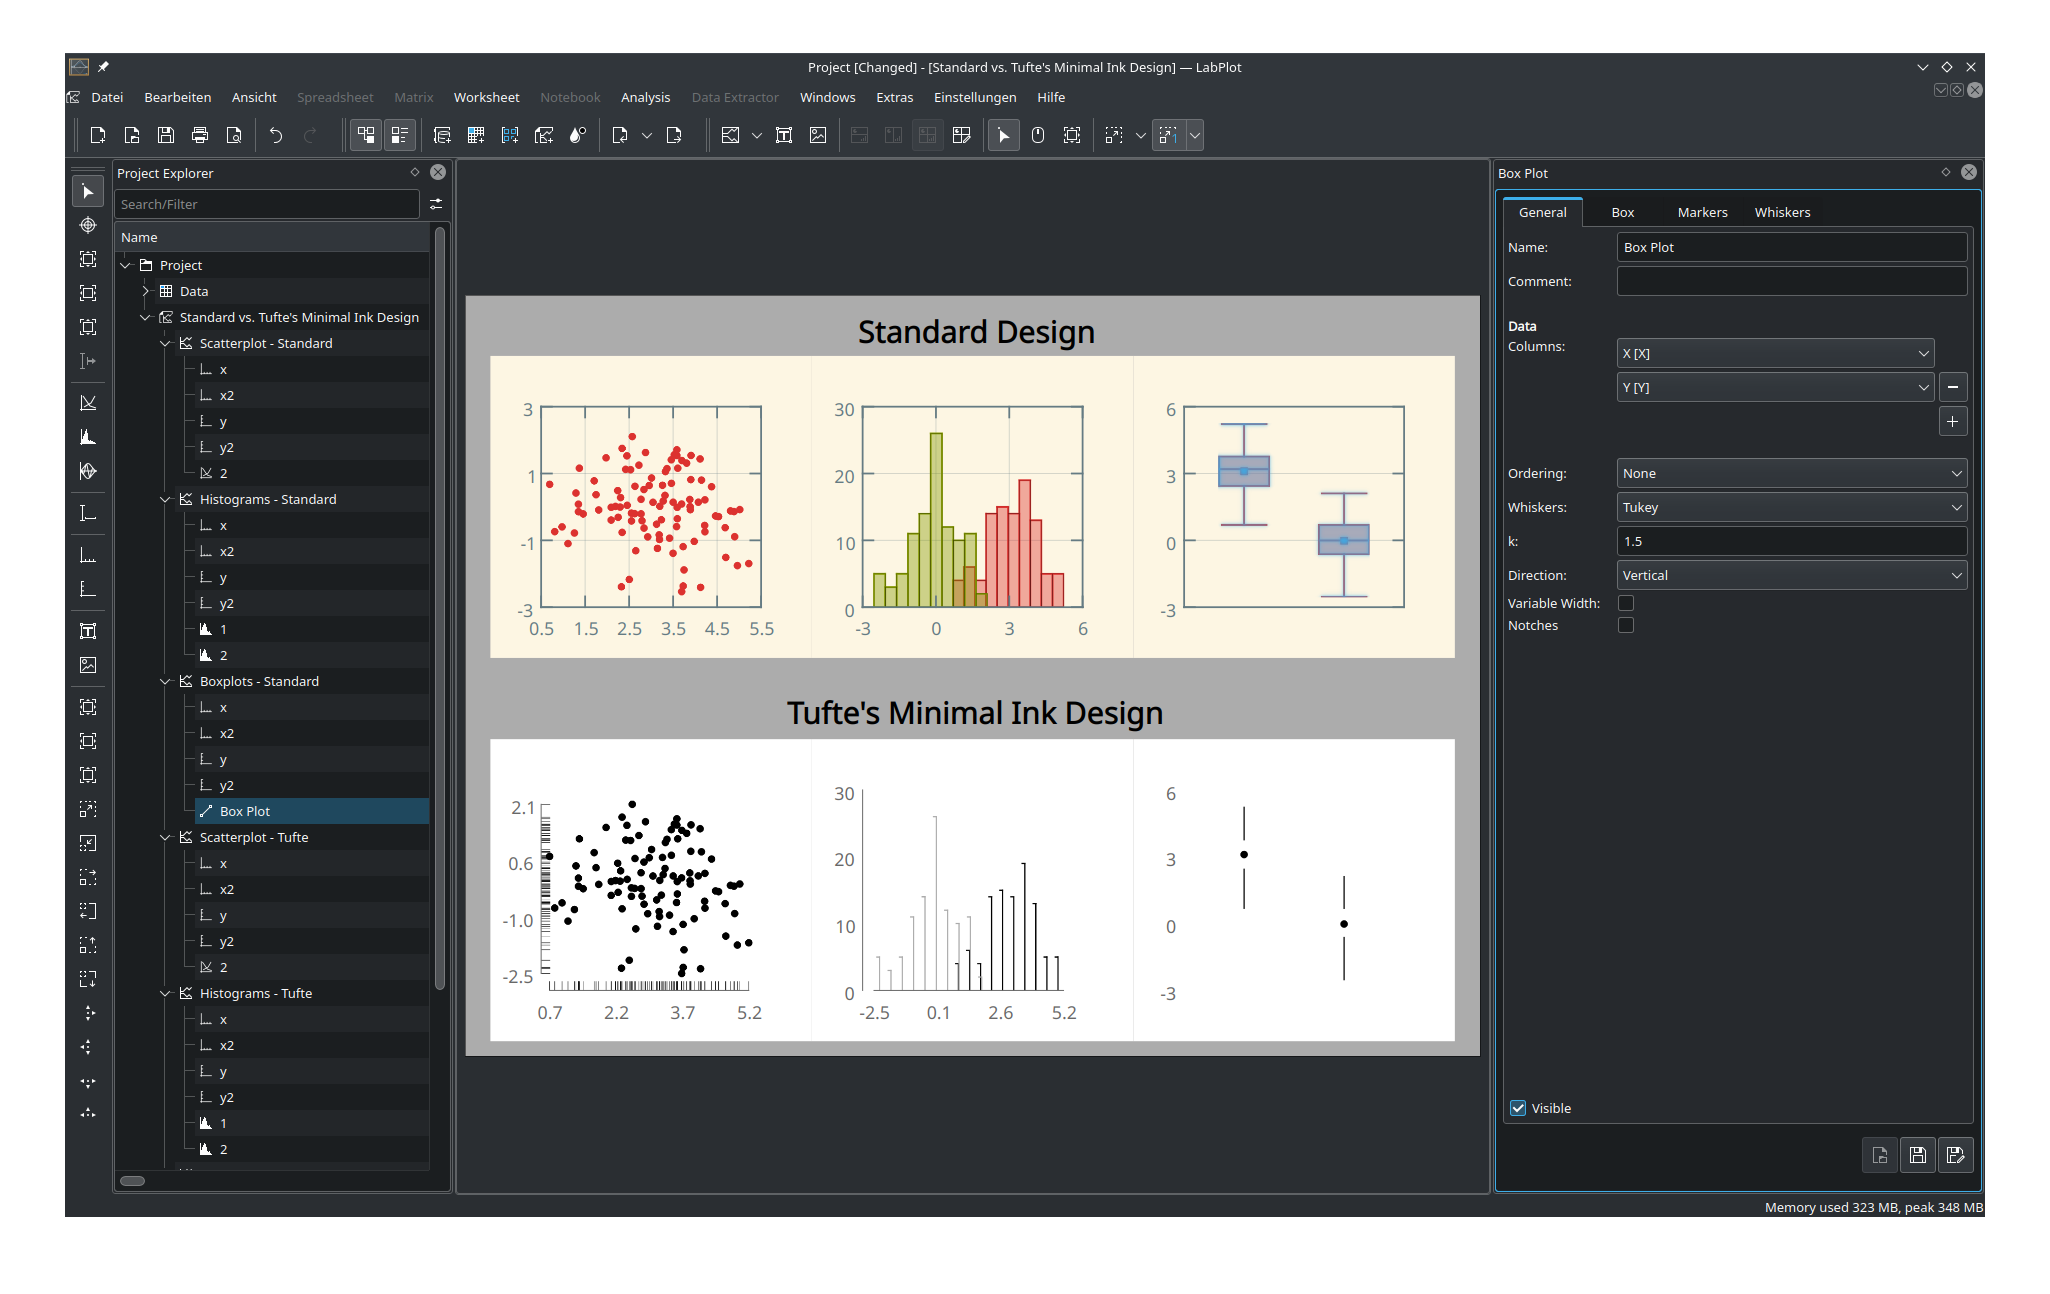
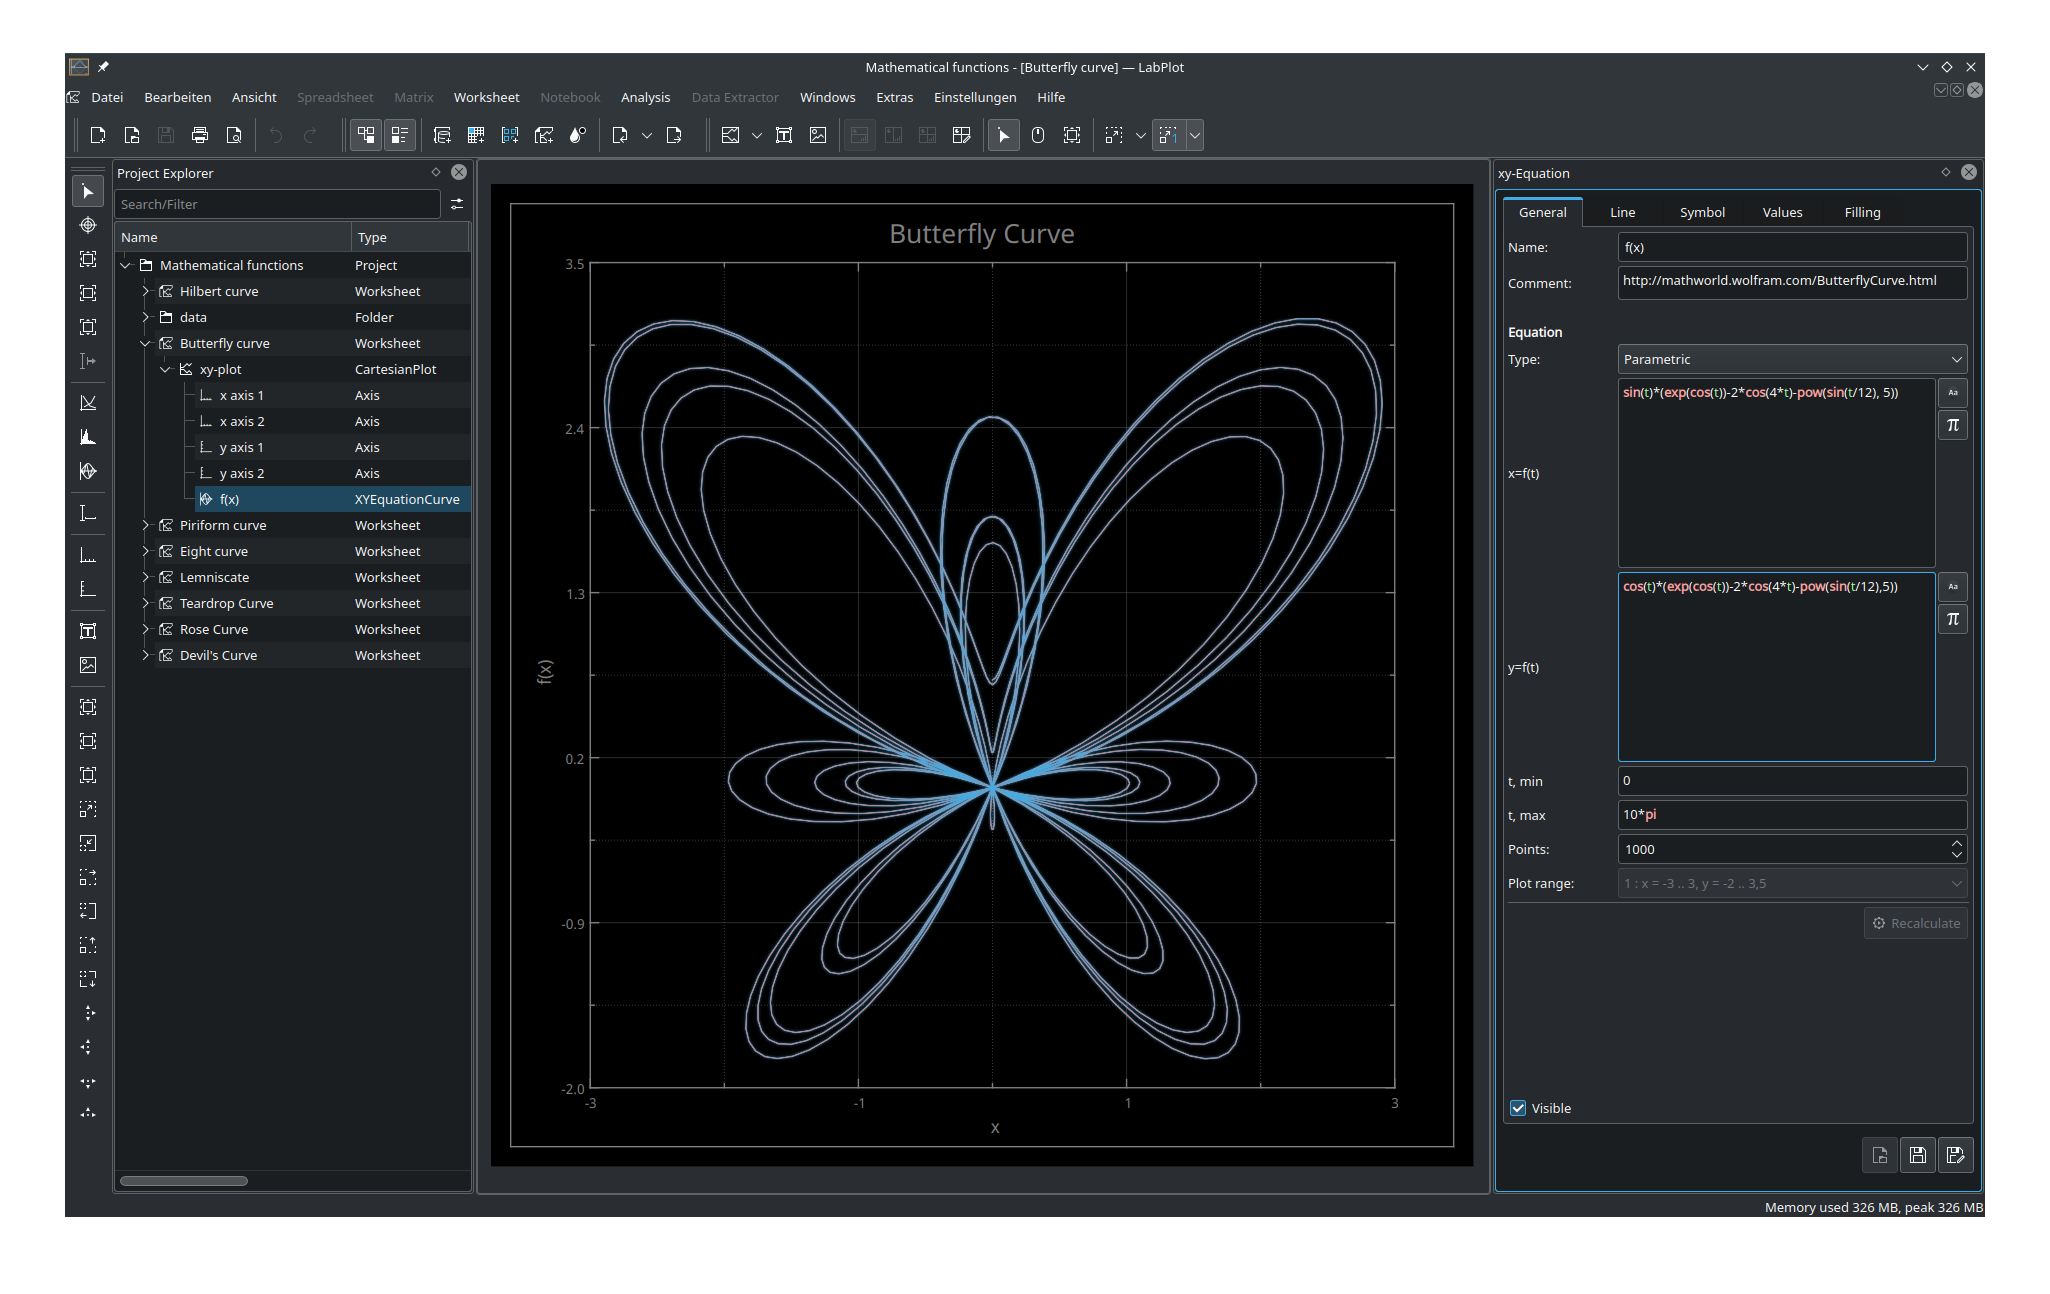
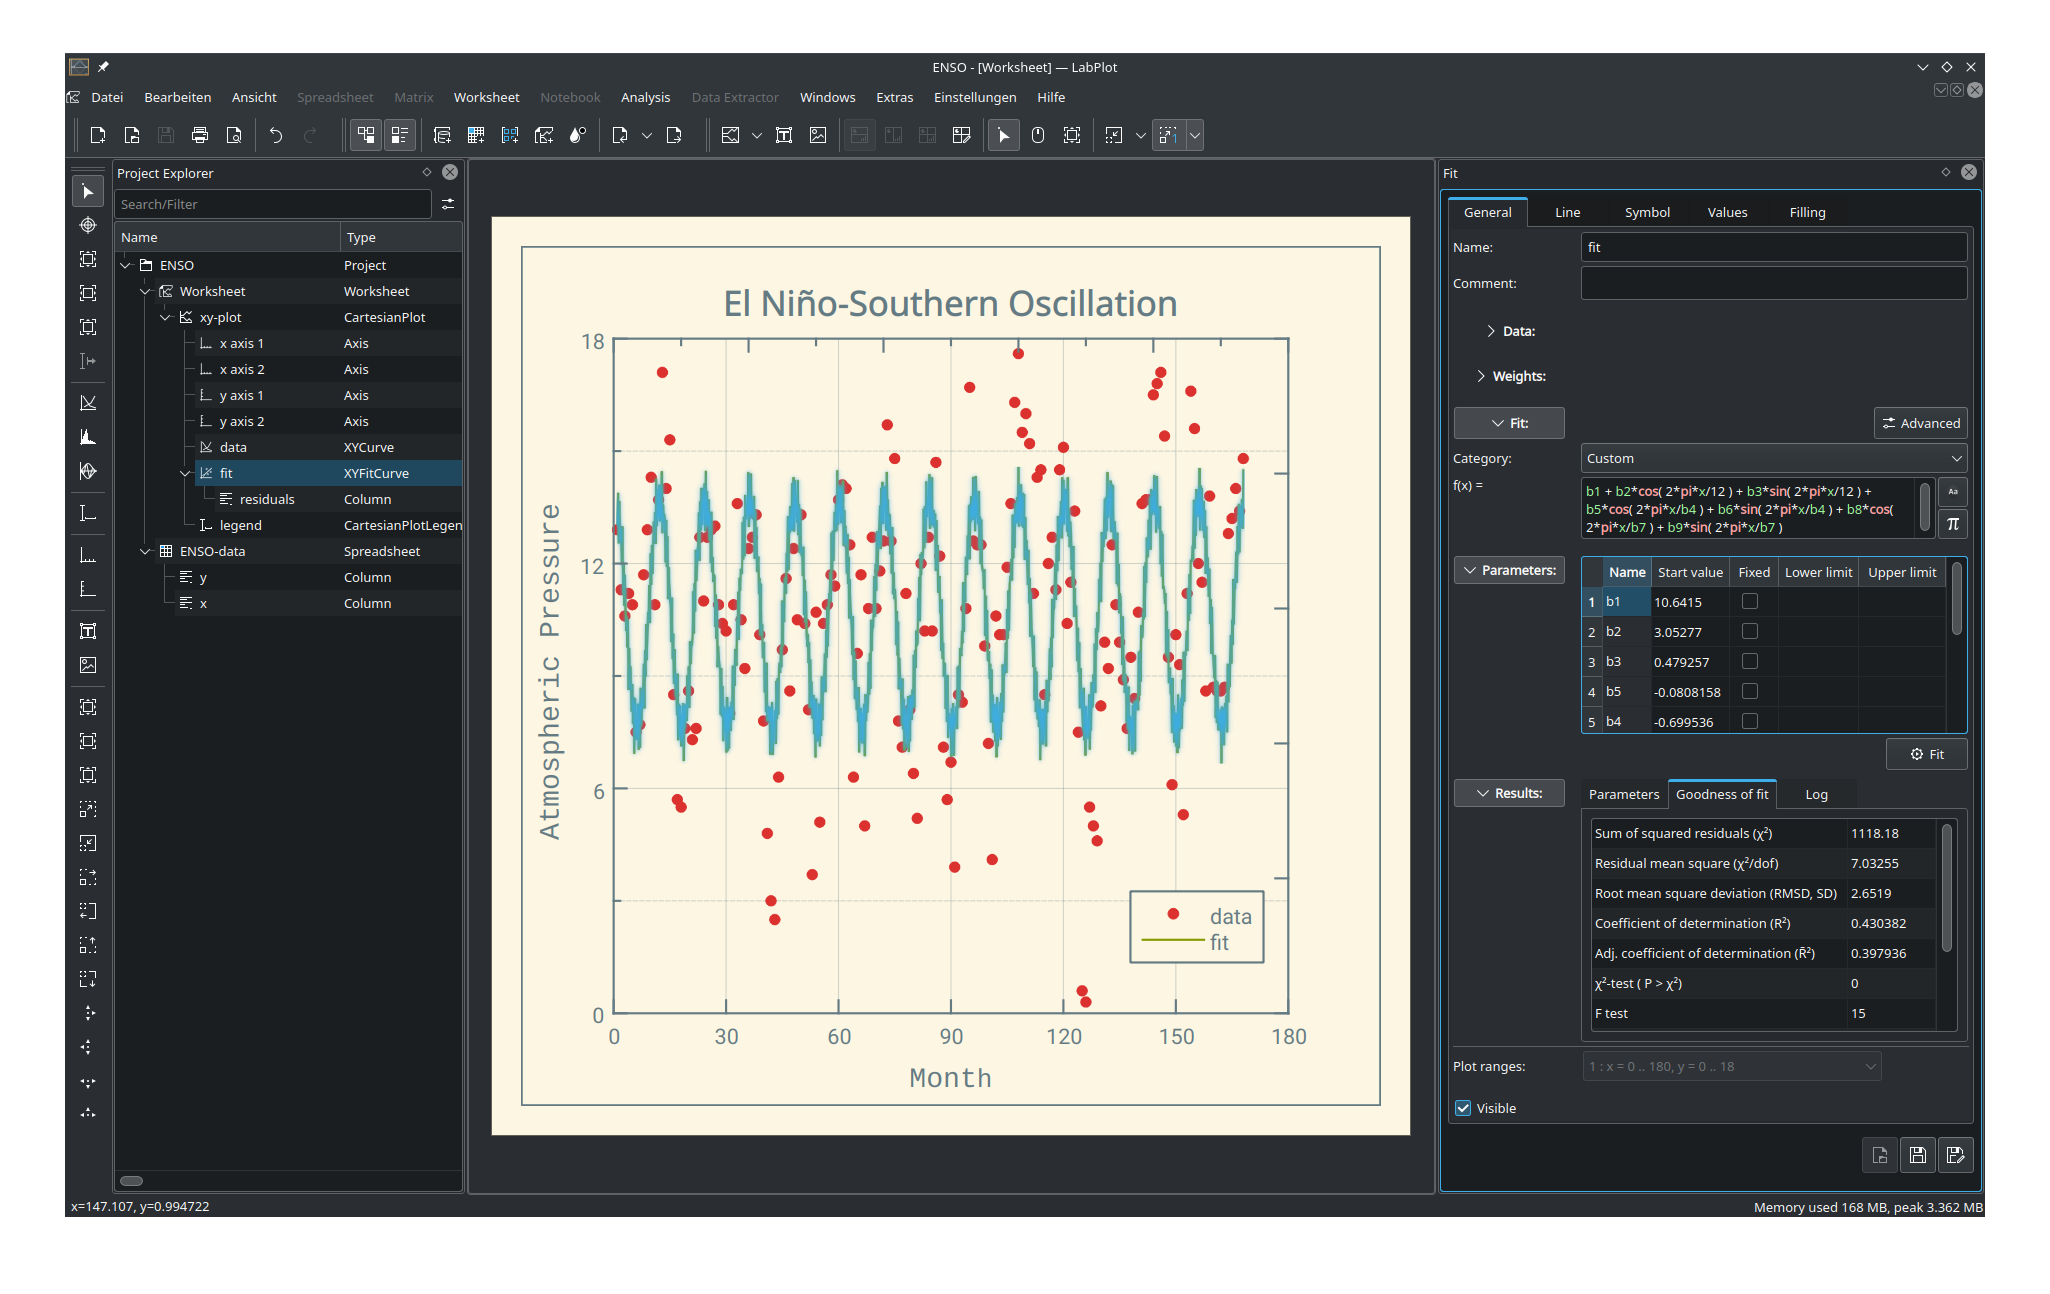
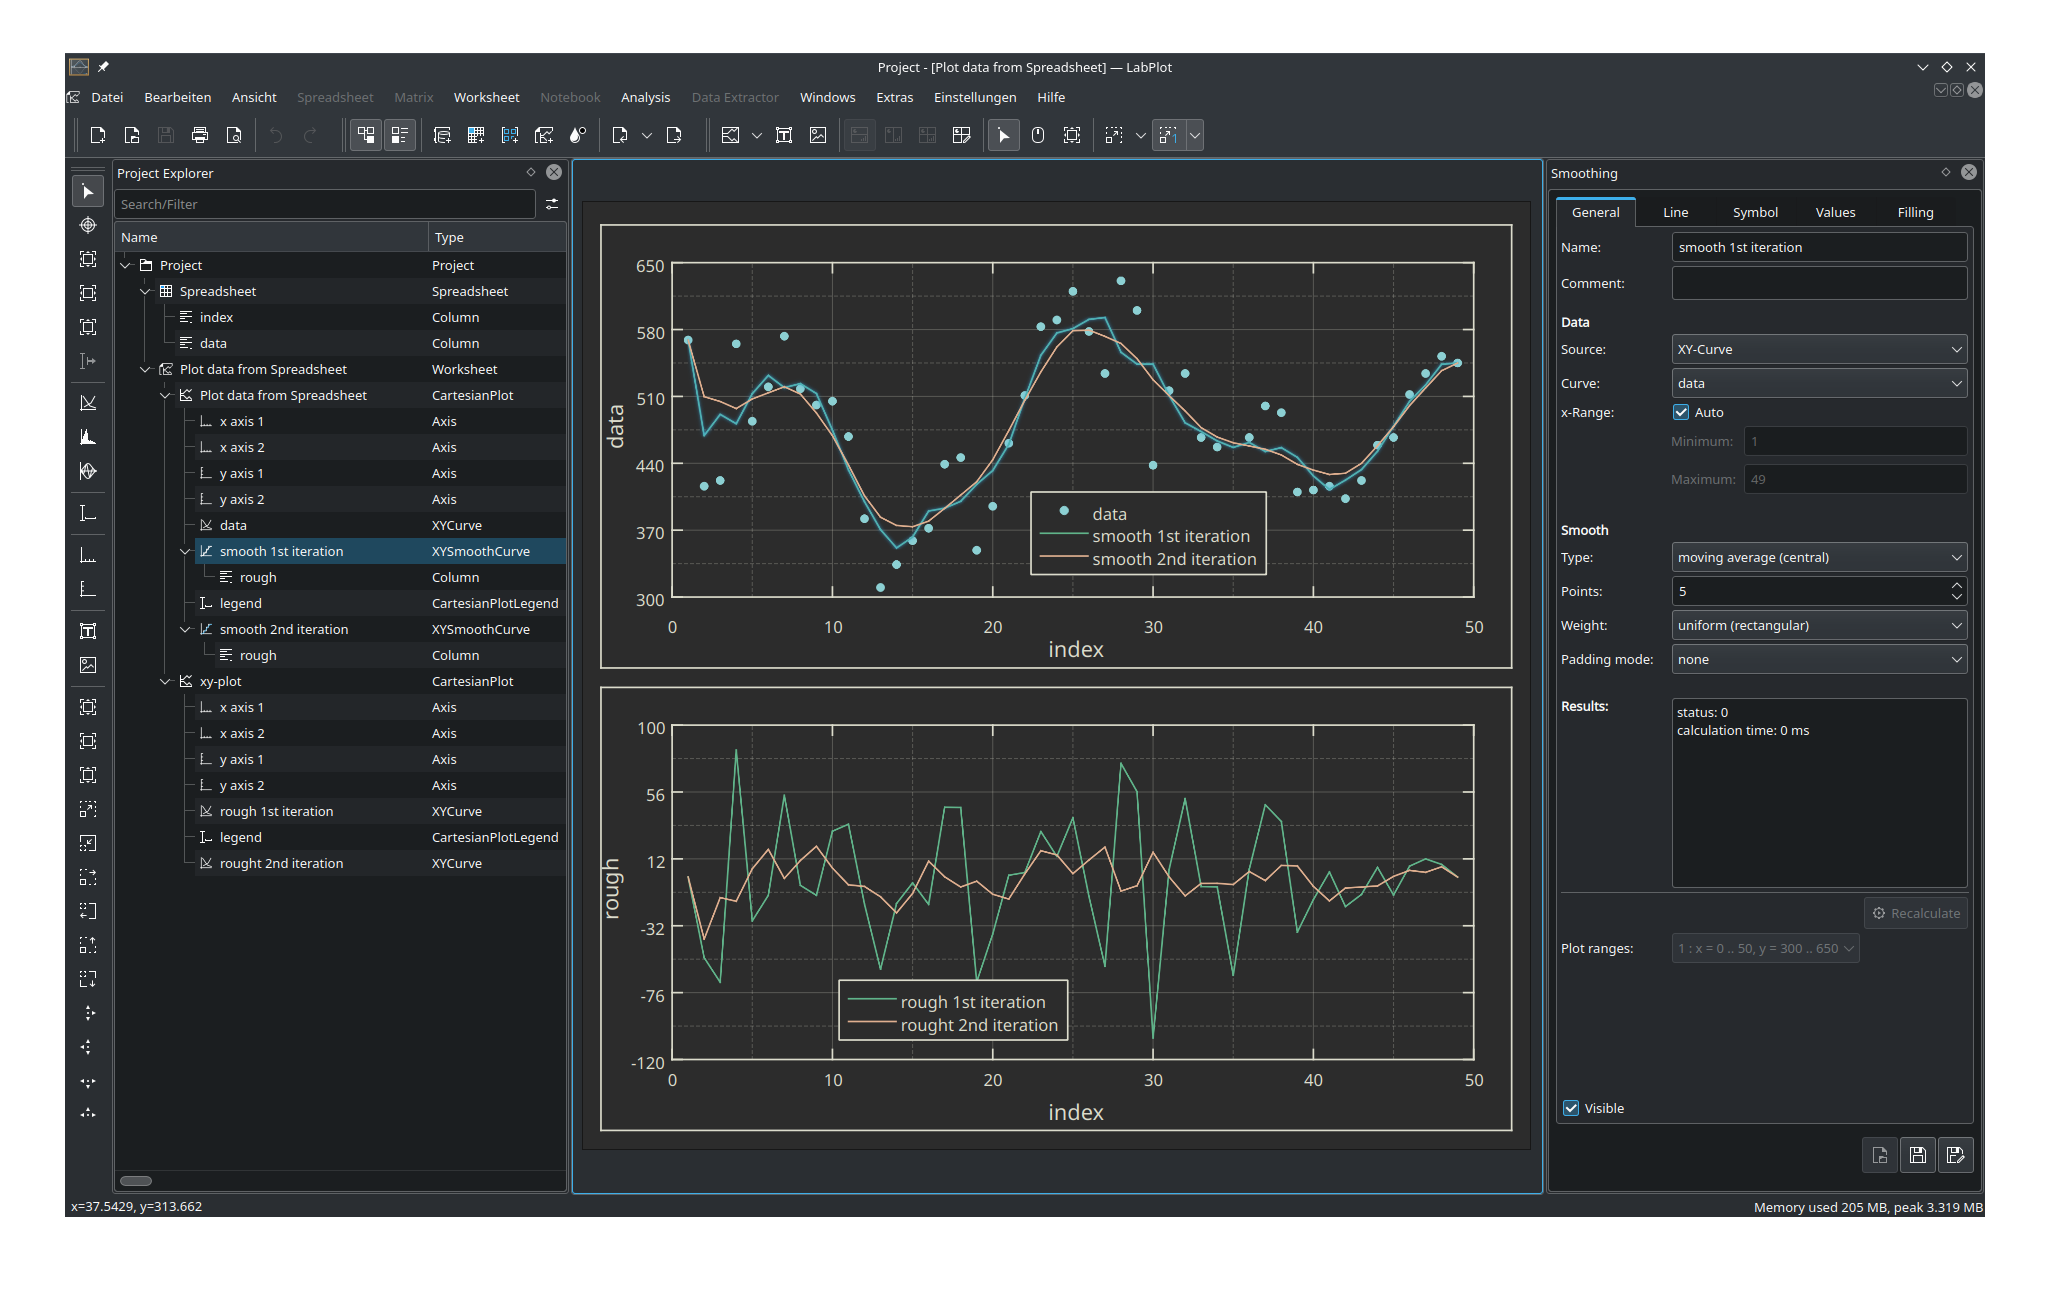
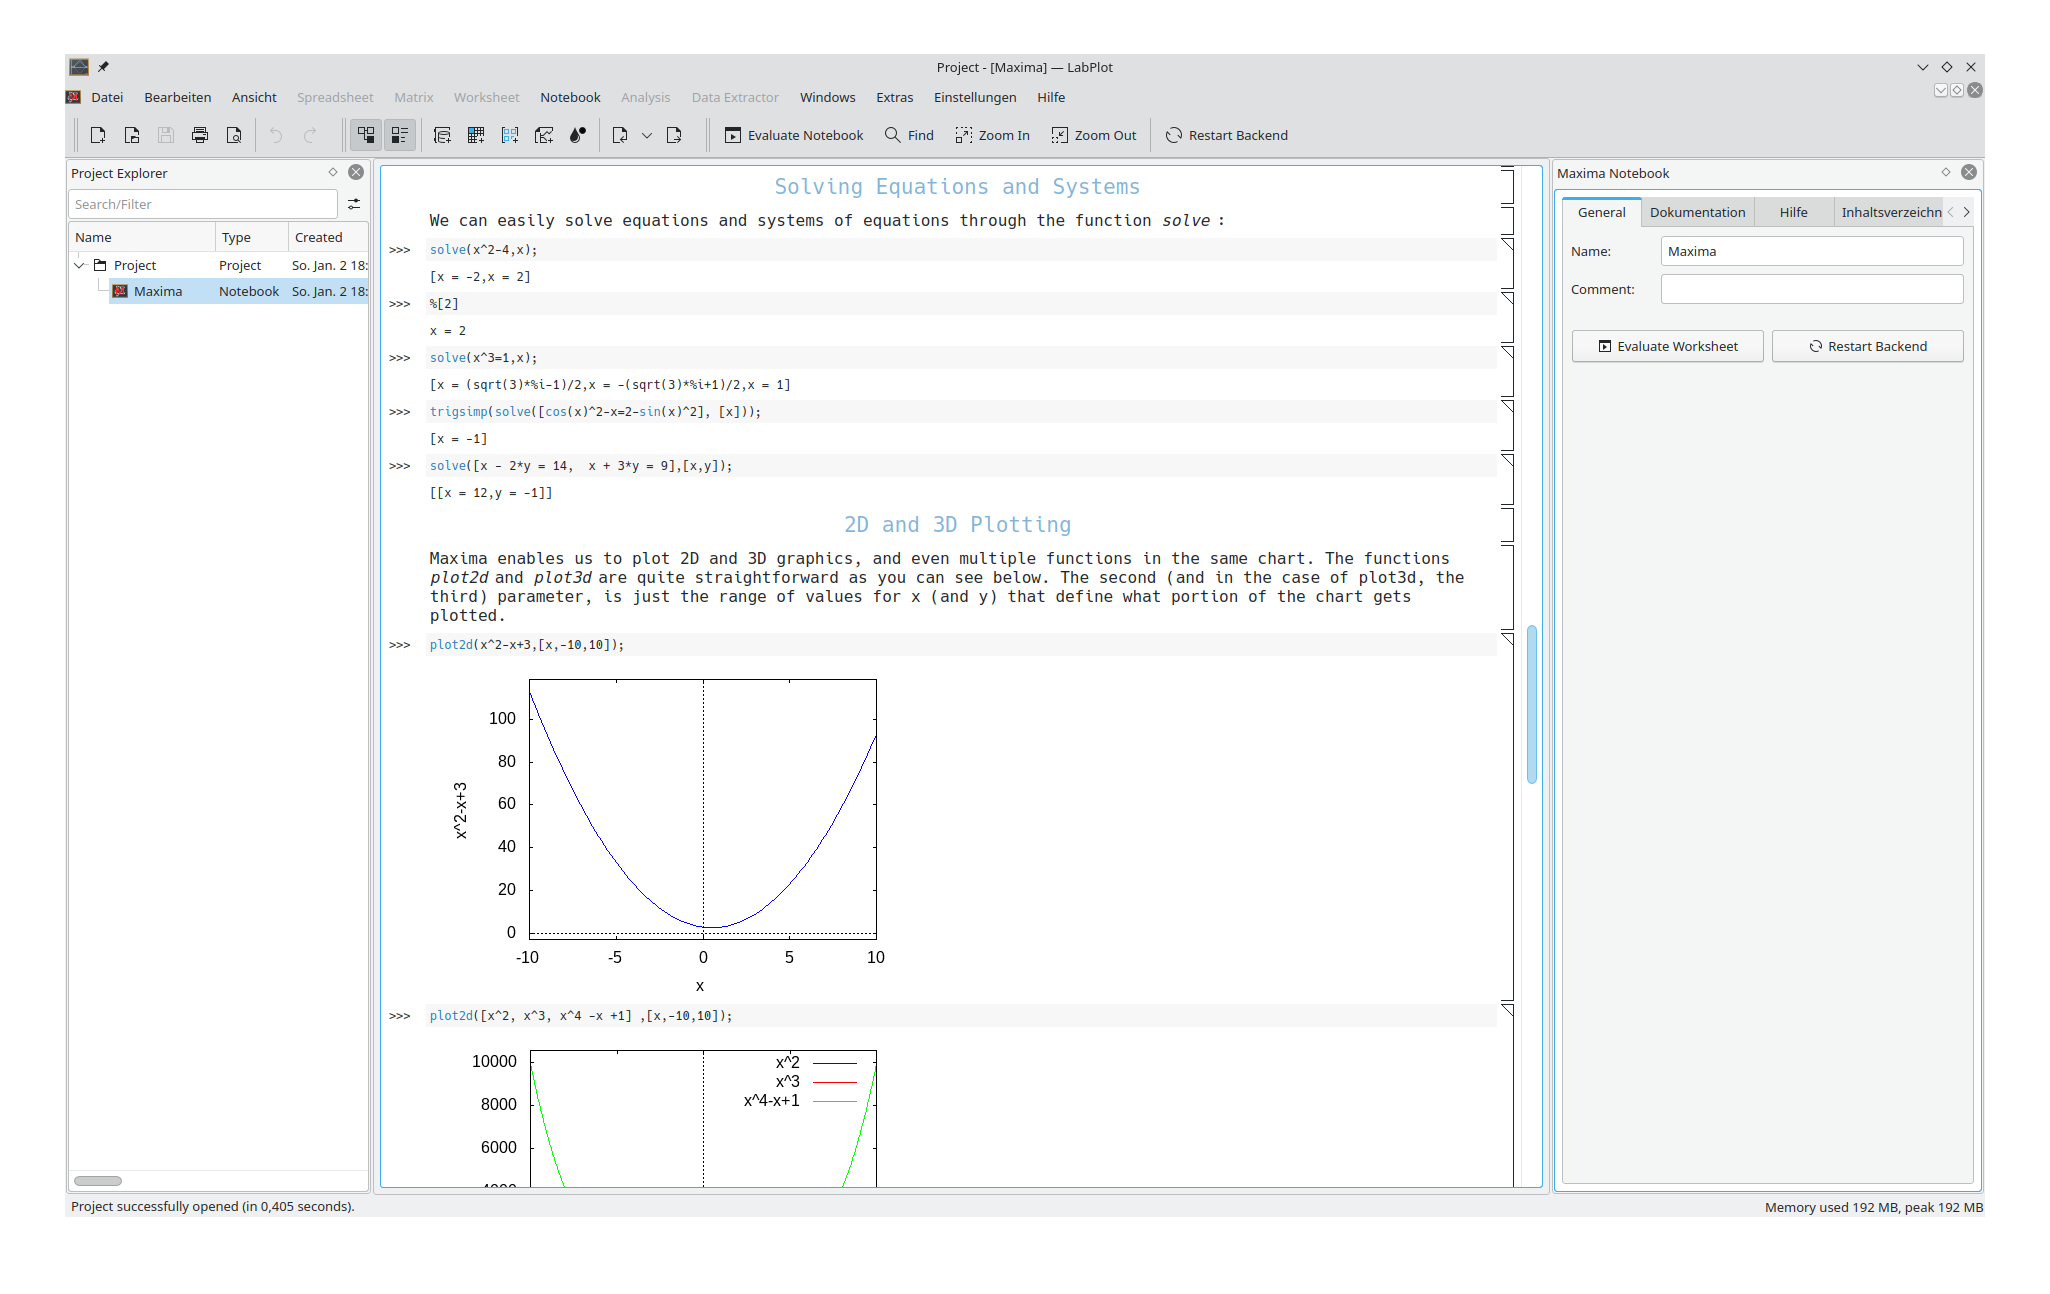
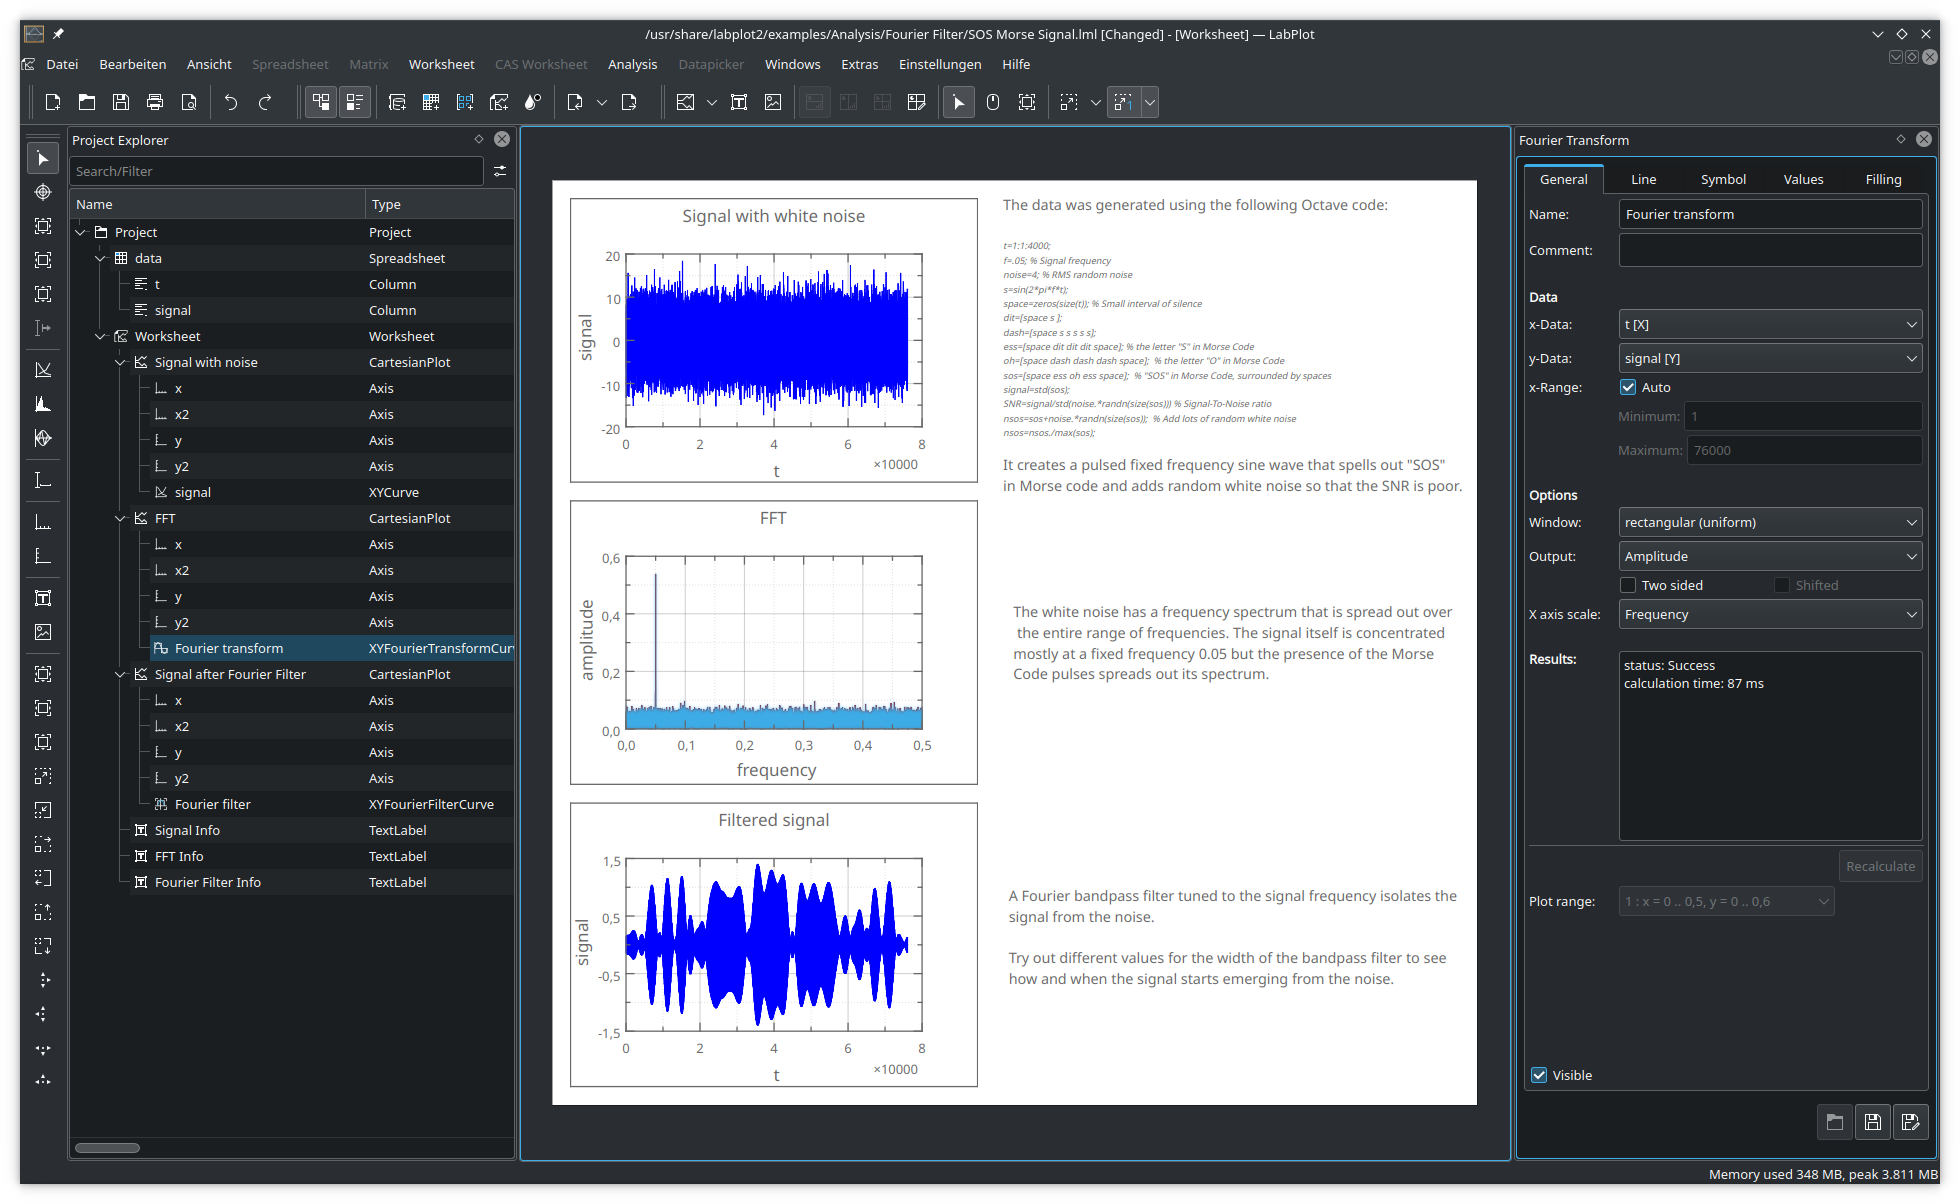
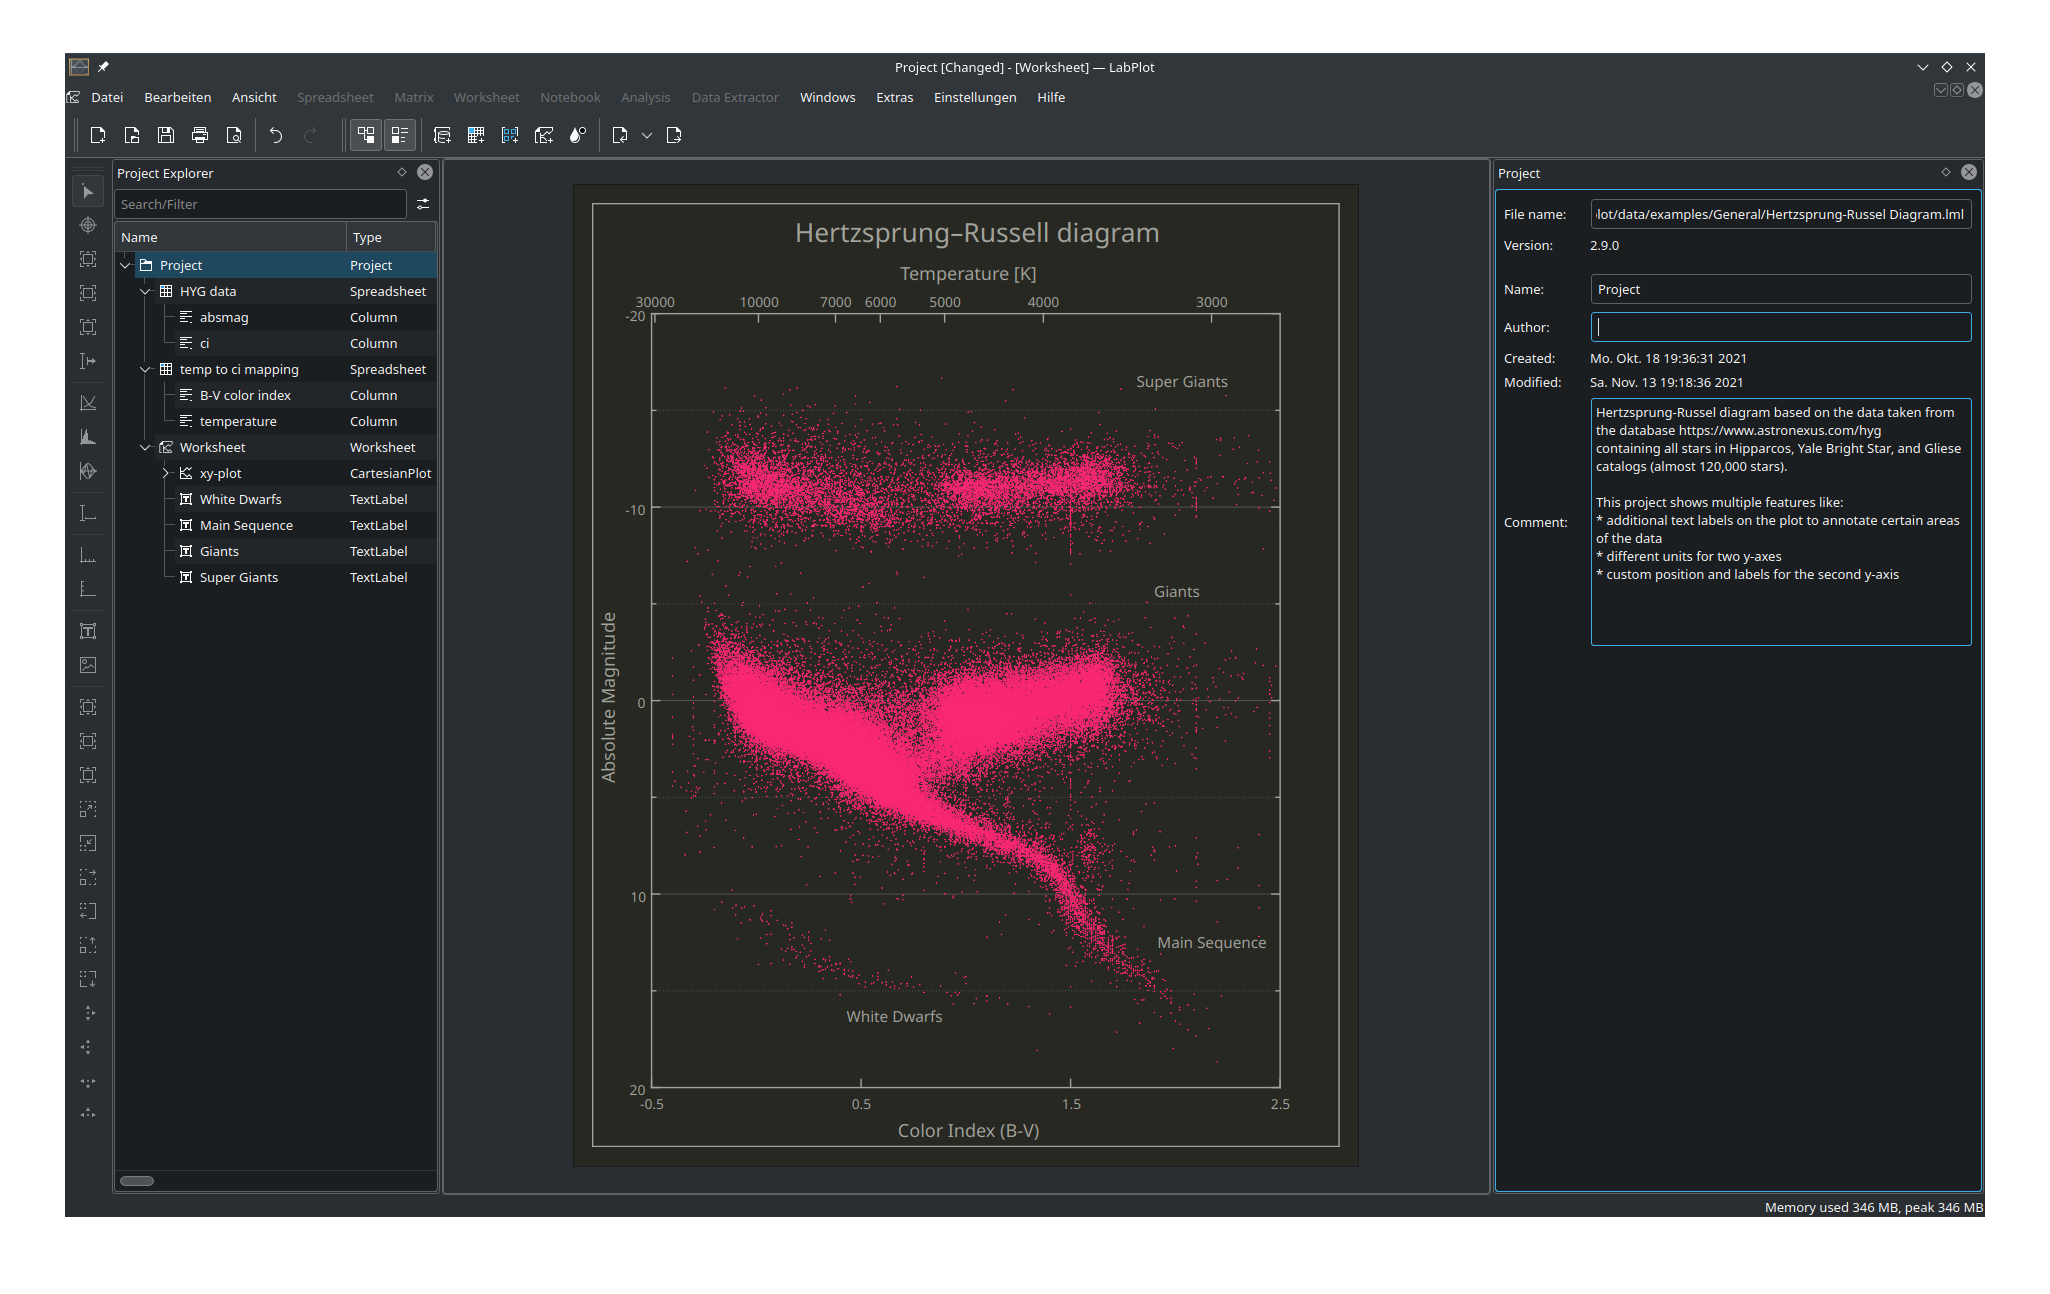
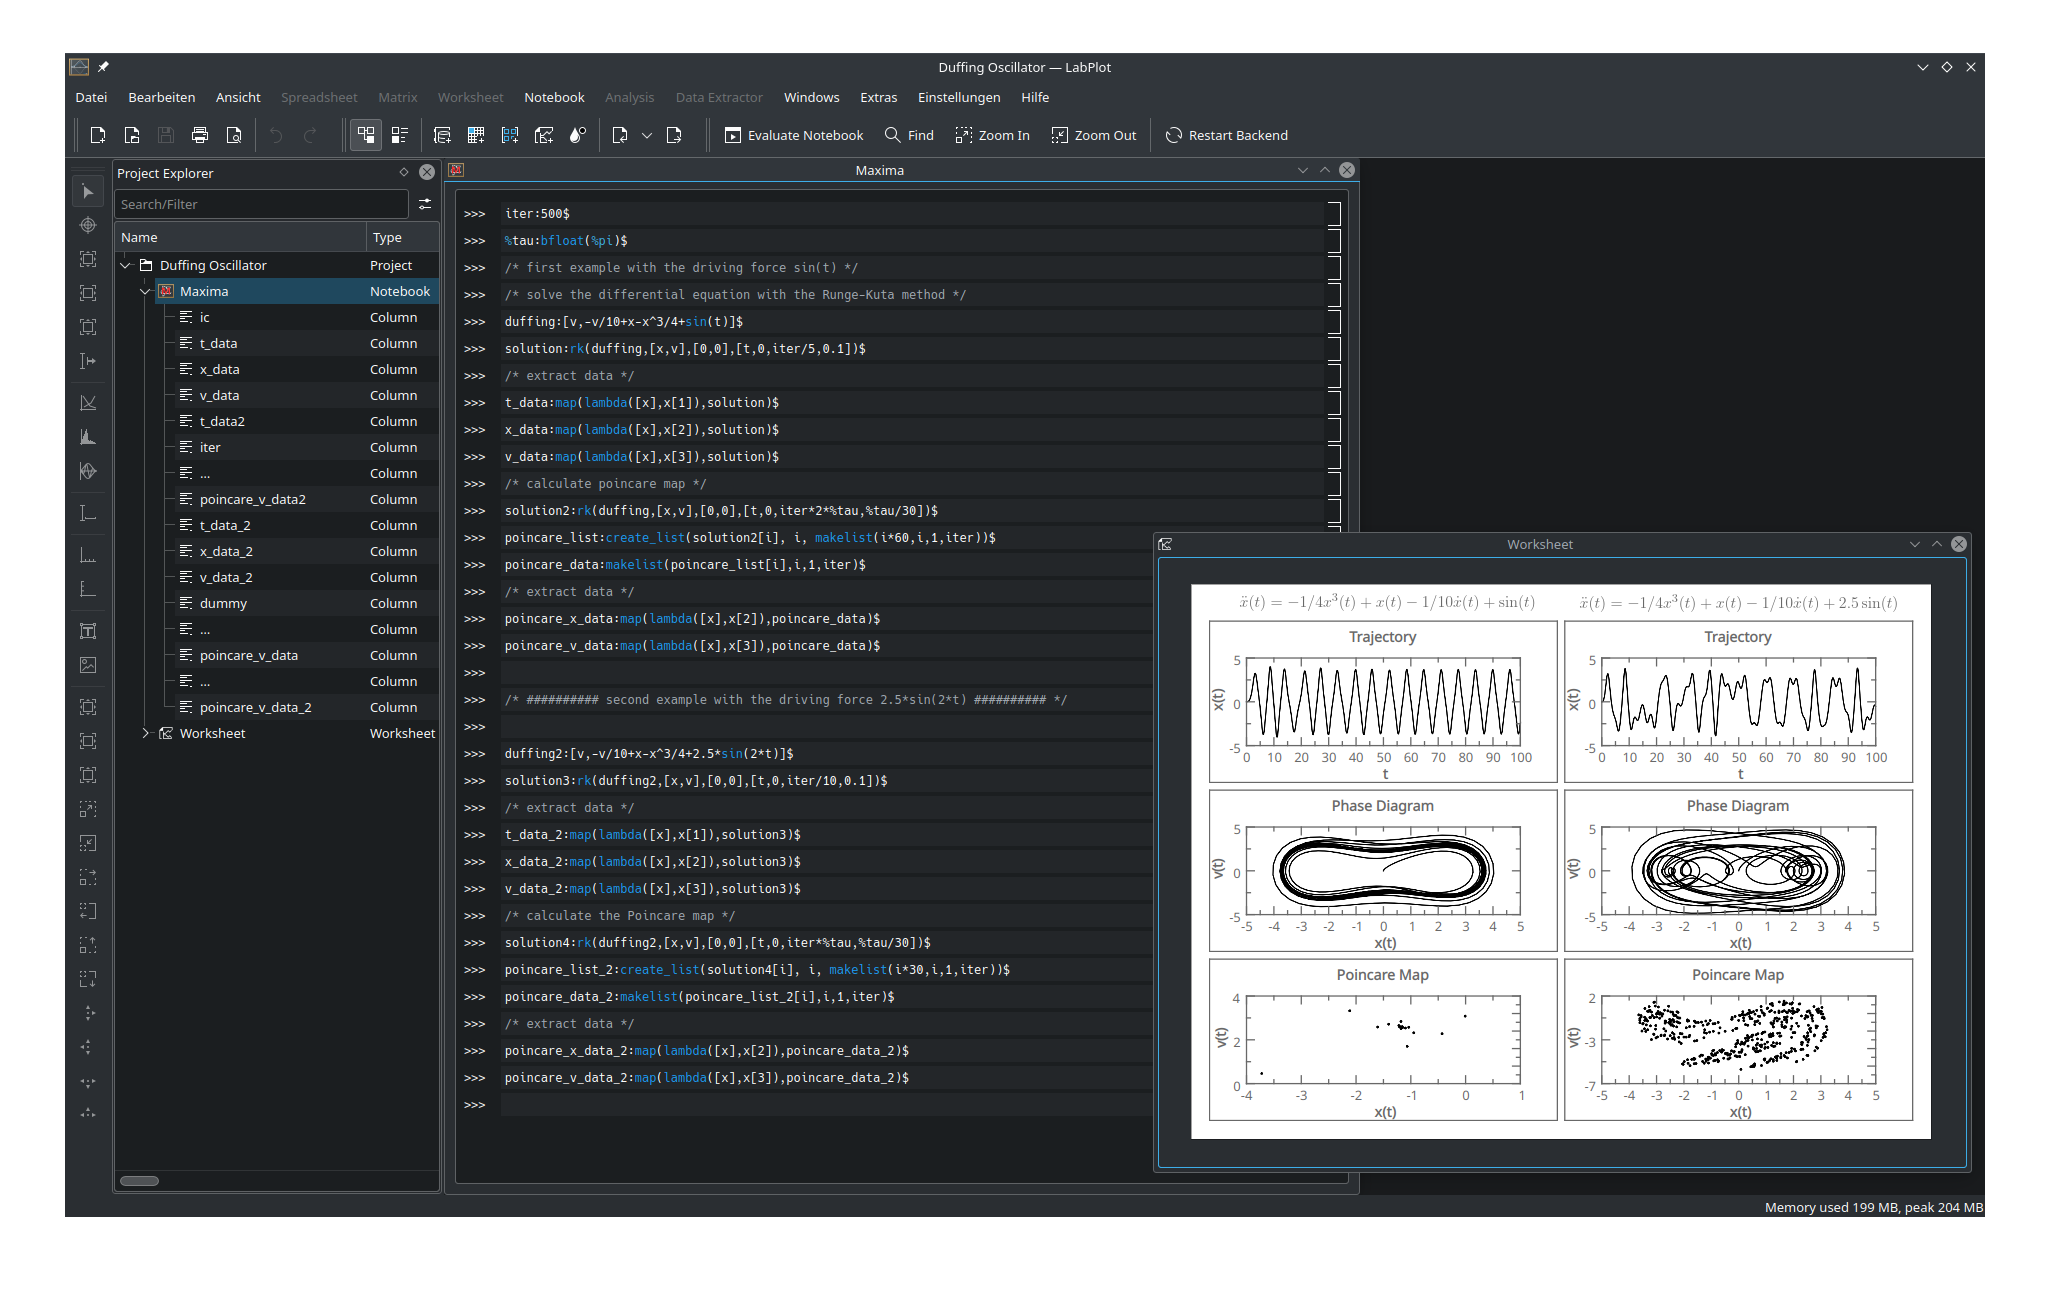
LabPlot is a FREE, open source and cross-platform Data Visualization and Analysis software accessible to everyone.
LabPlot provides an easy way to create, manage and edit plots. It allows you to produce plots based on data from a spreadsheet or on data imported from external files. Plots can be exported to several pixmap and vector graphic formats.

Telepítés
Linuxon


Kiadások RSS
2.11.1
2024-07-16
2.11.0
2024-07-09
2.10.1
2023-07-11
2.10.0
2023-03-21
2.9.0
2022-05-03
2.8.2
2021-04-01
2.8.1
2020-11-13
2.8.0
2020-09-16
Nightly installers
LabPlot nightly installers are also available to download from the KDE CDN. These versions are intended for testing purpose. Get involved and help us make them better!
Instabil verzió.
A fejlesztői ág legfrissebb verziójából van előállítva.