LabPlot
Categorias:
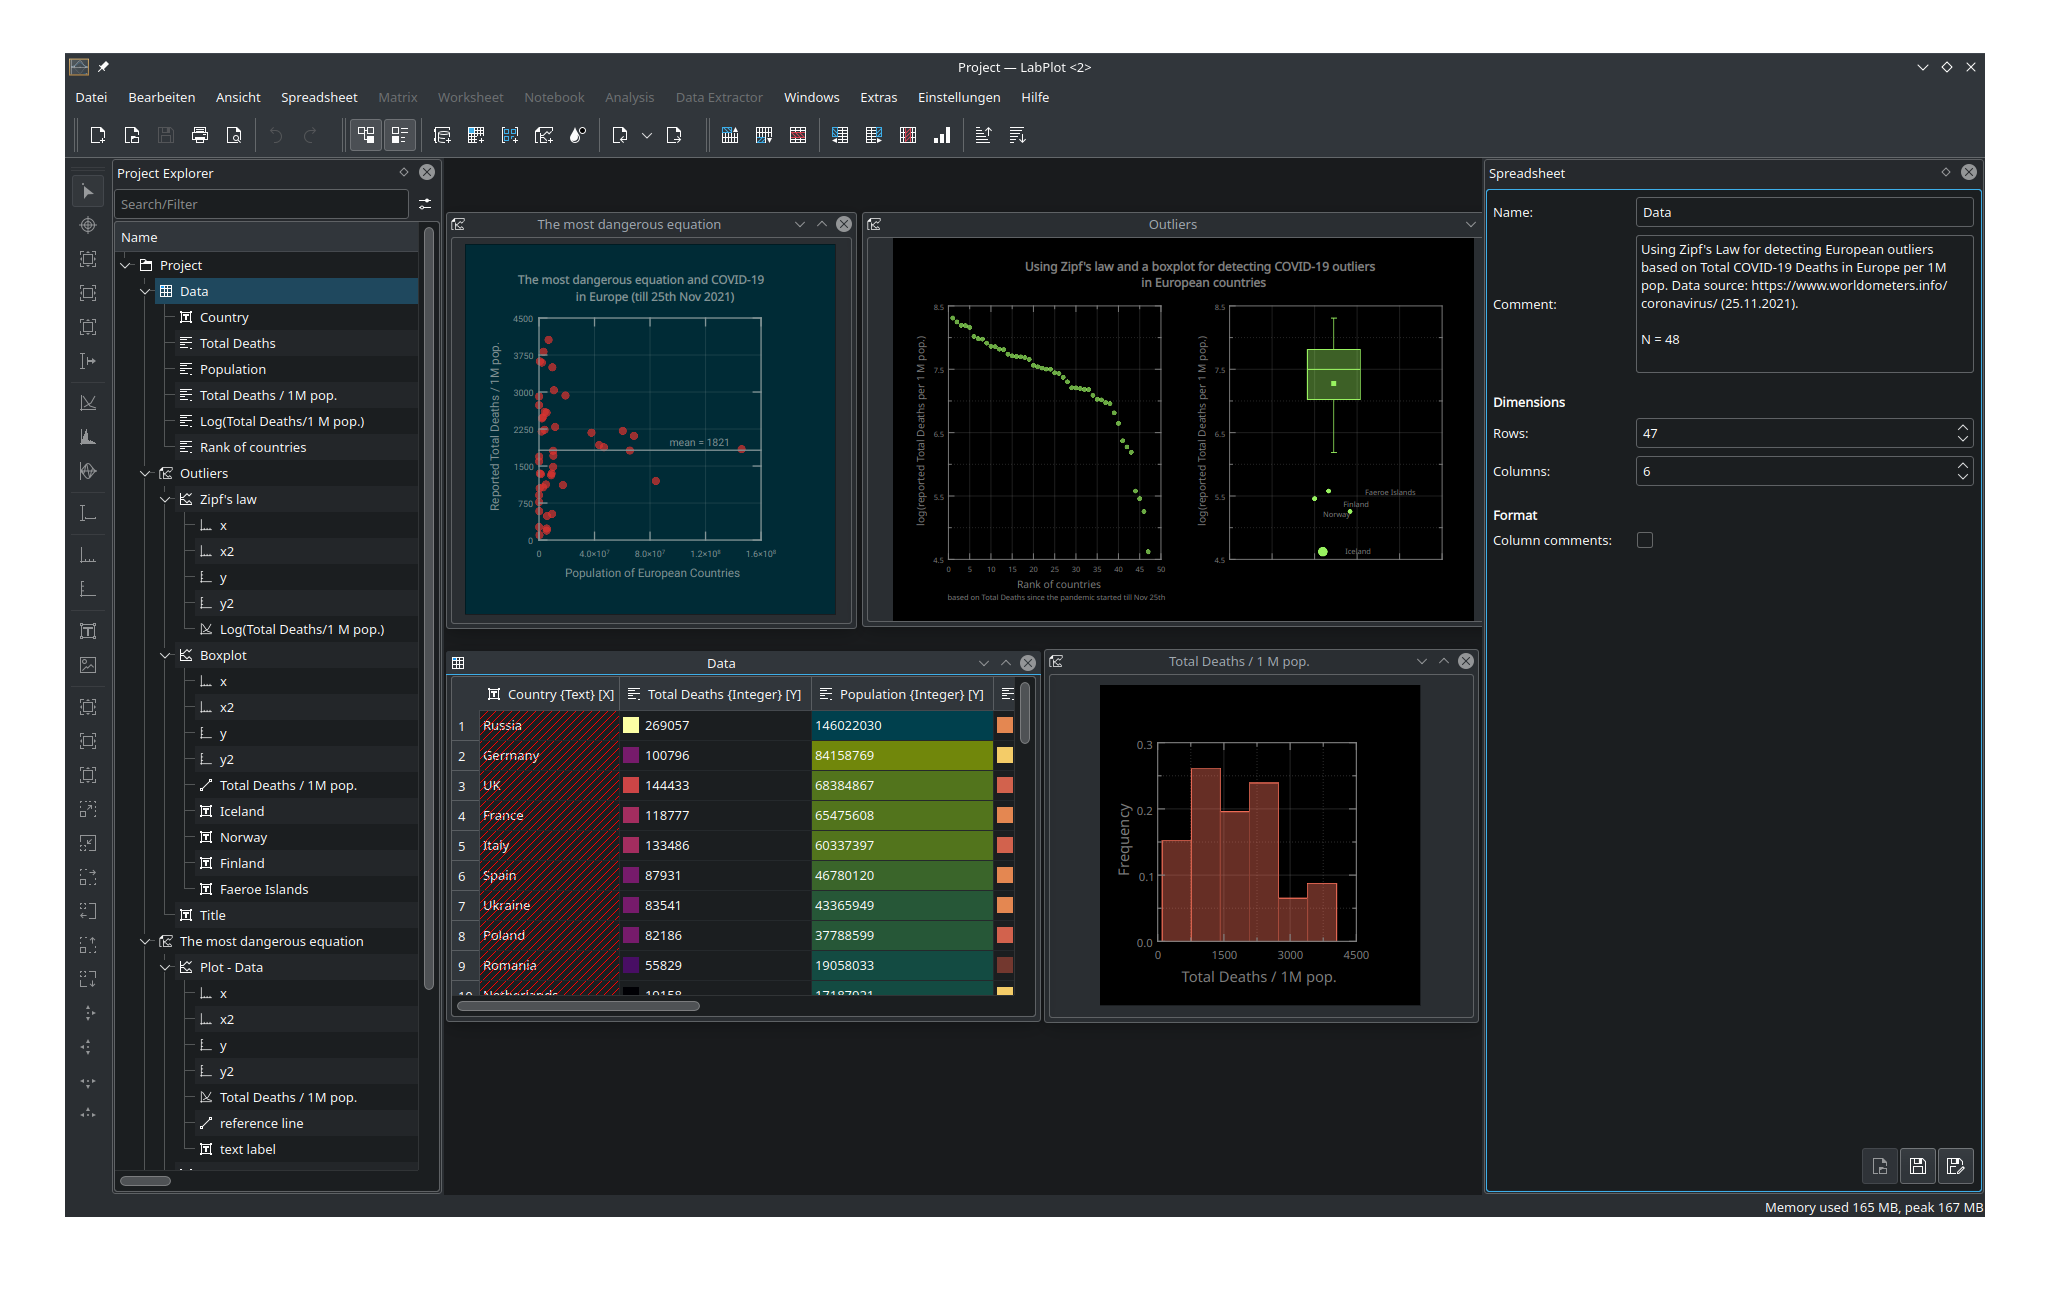
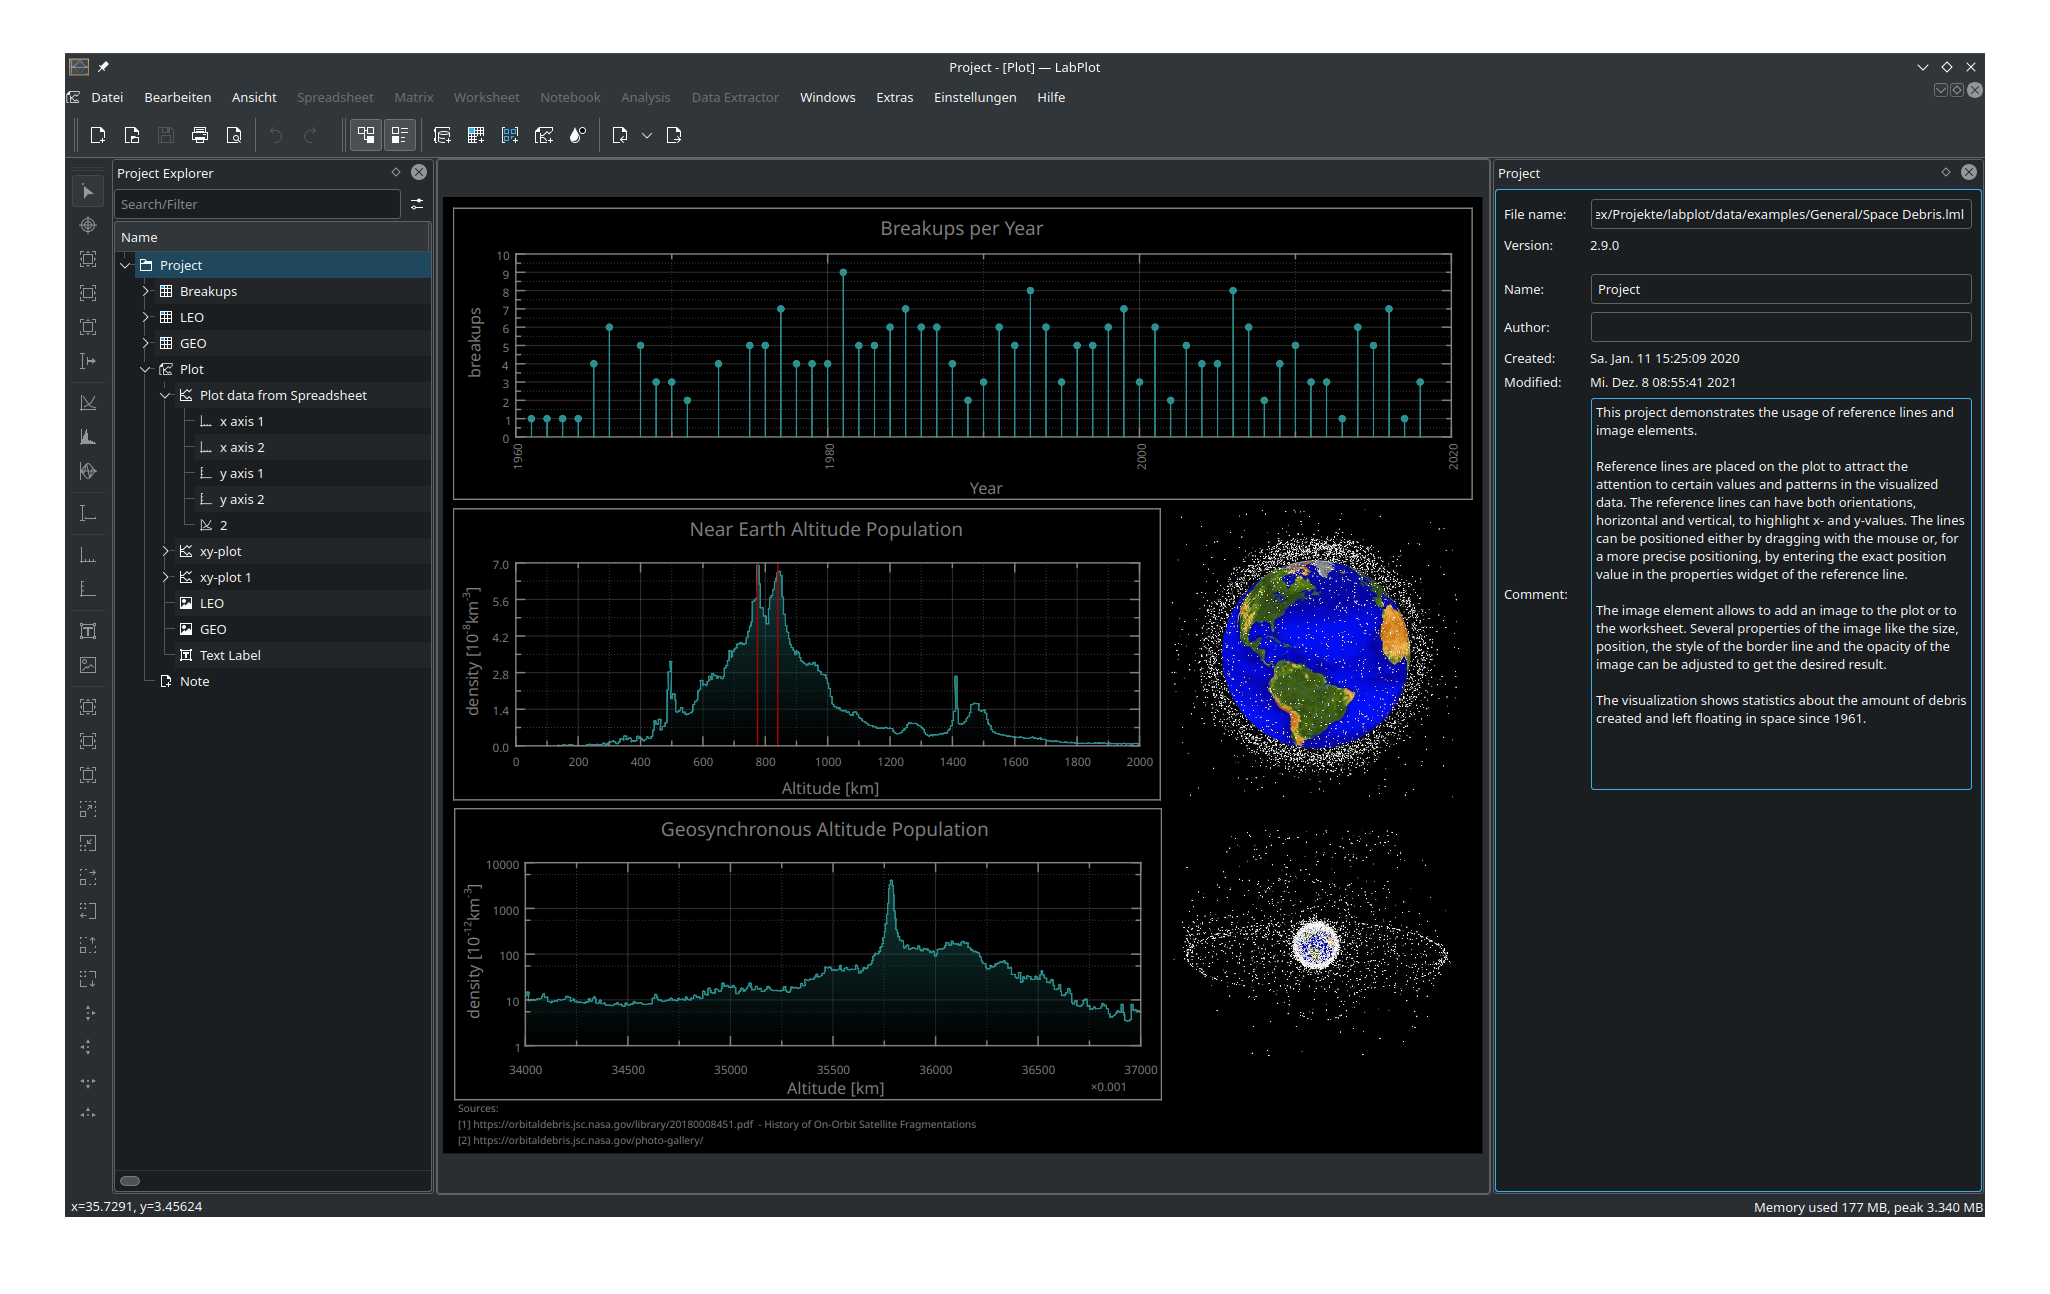
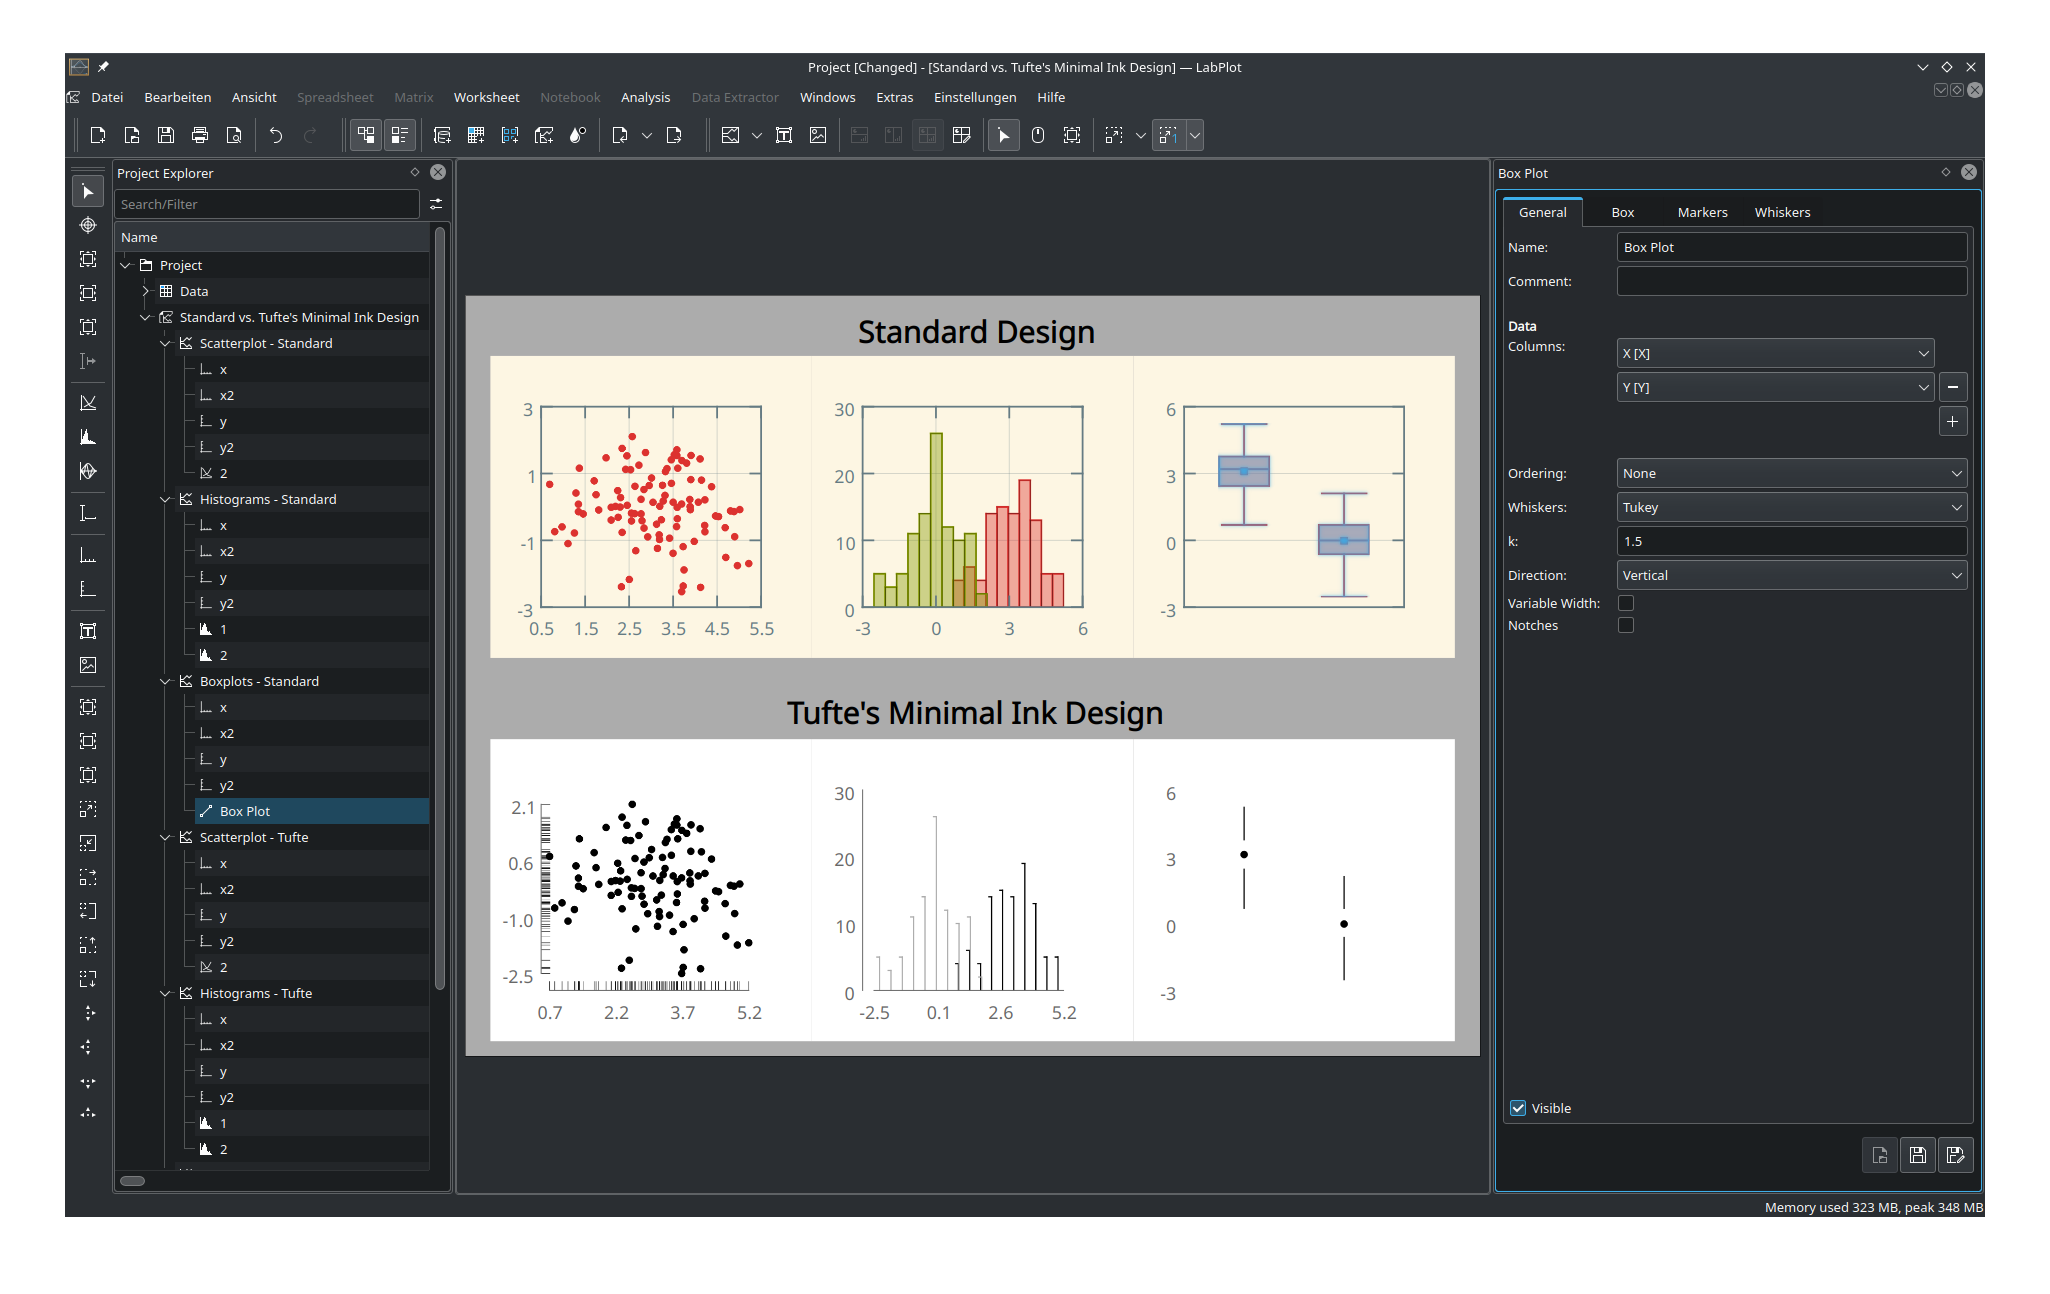
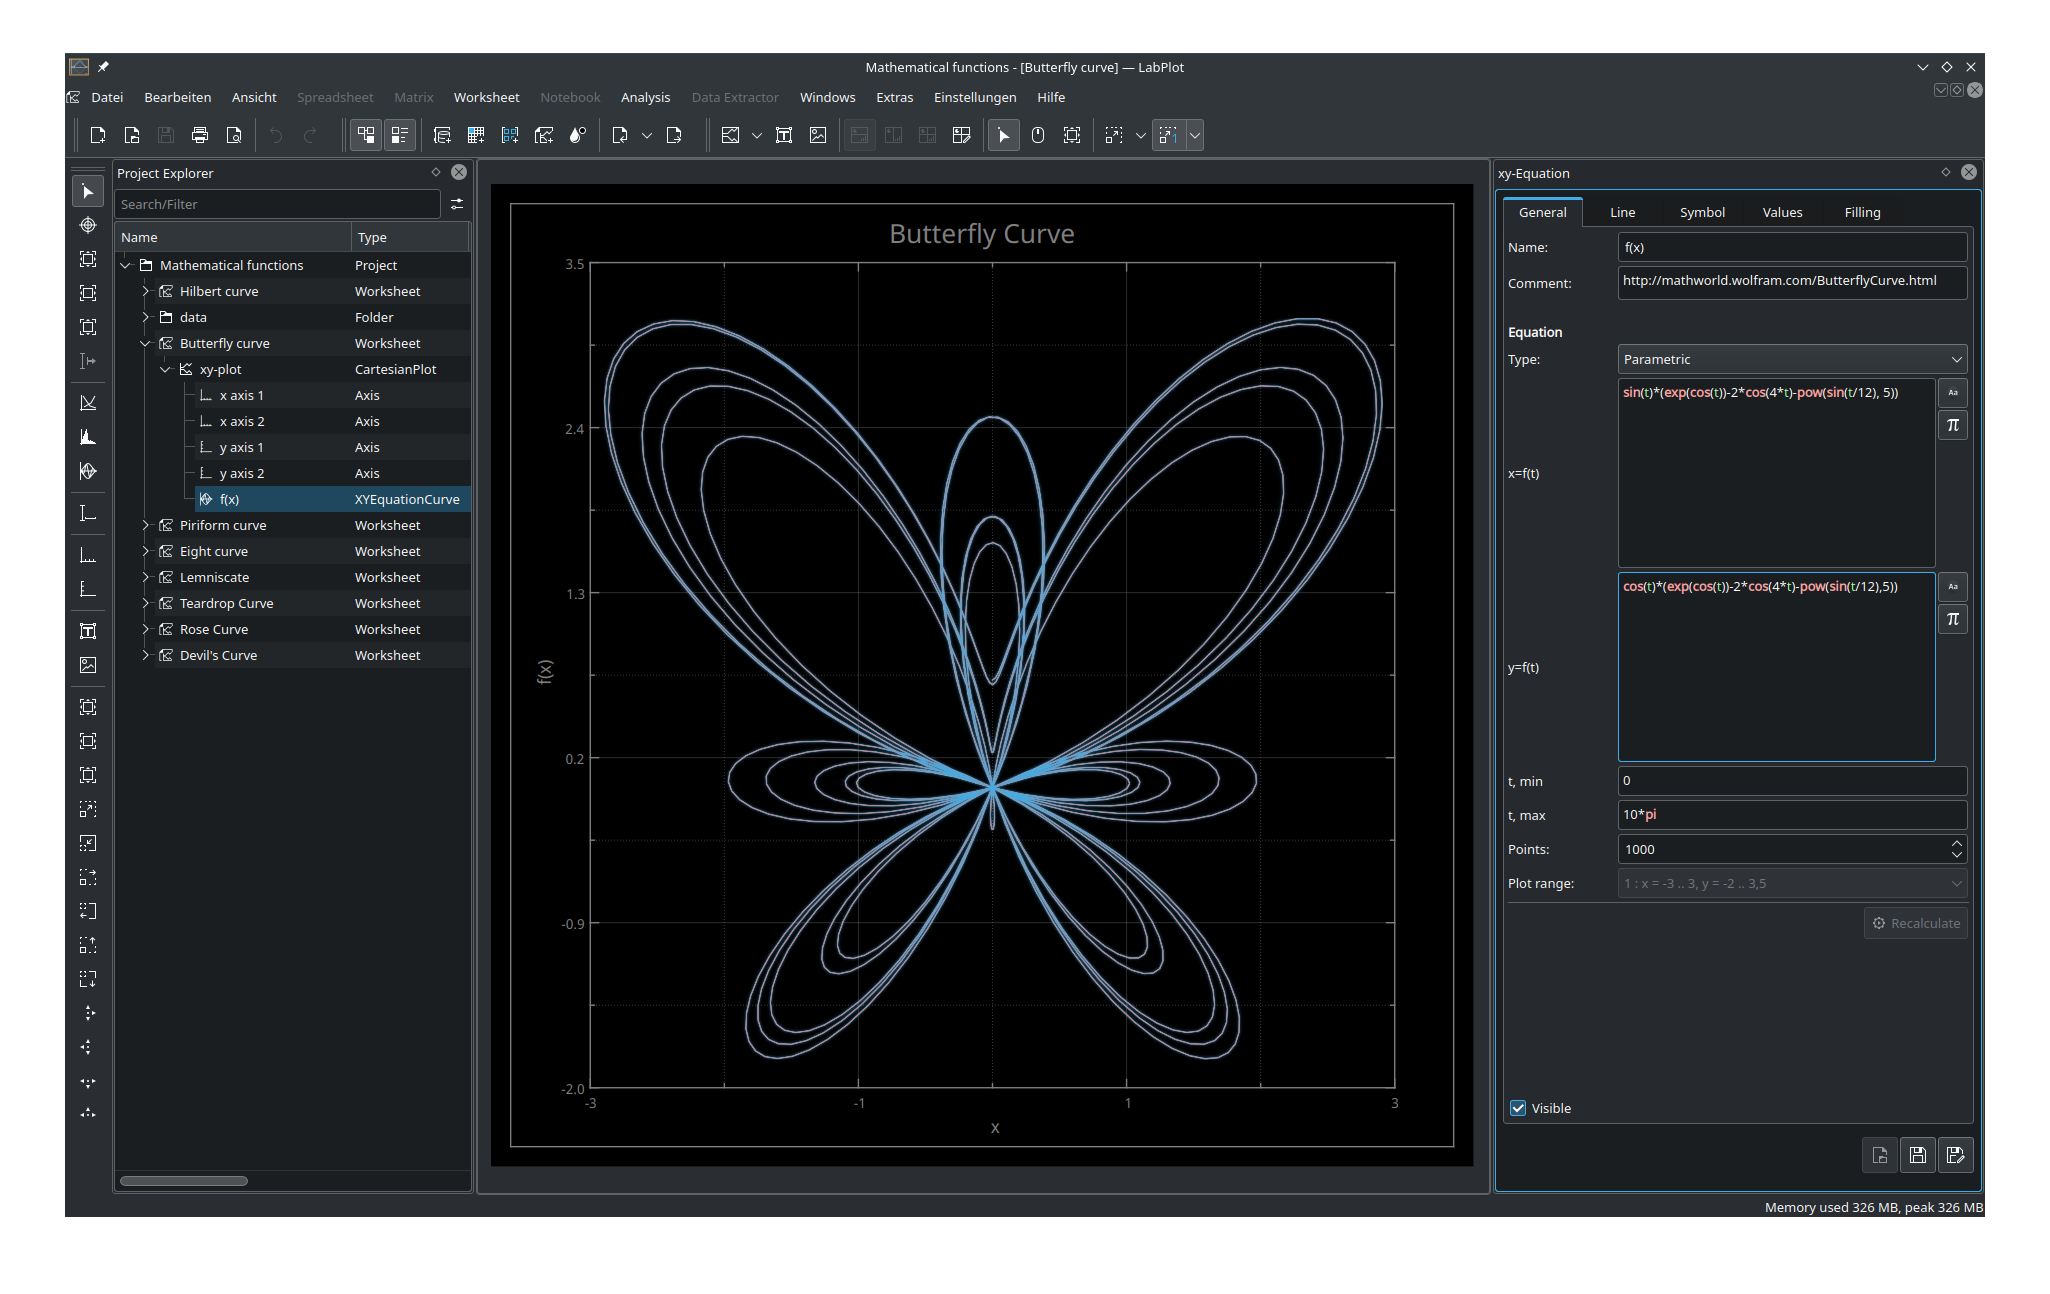
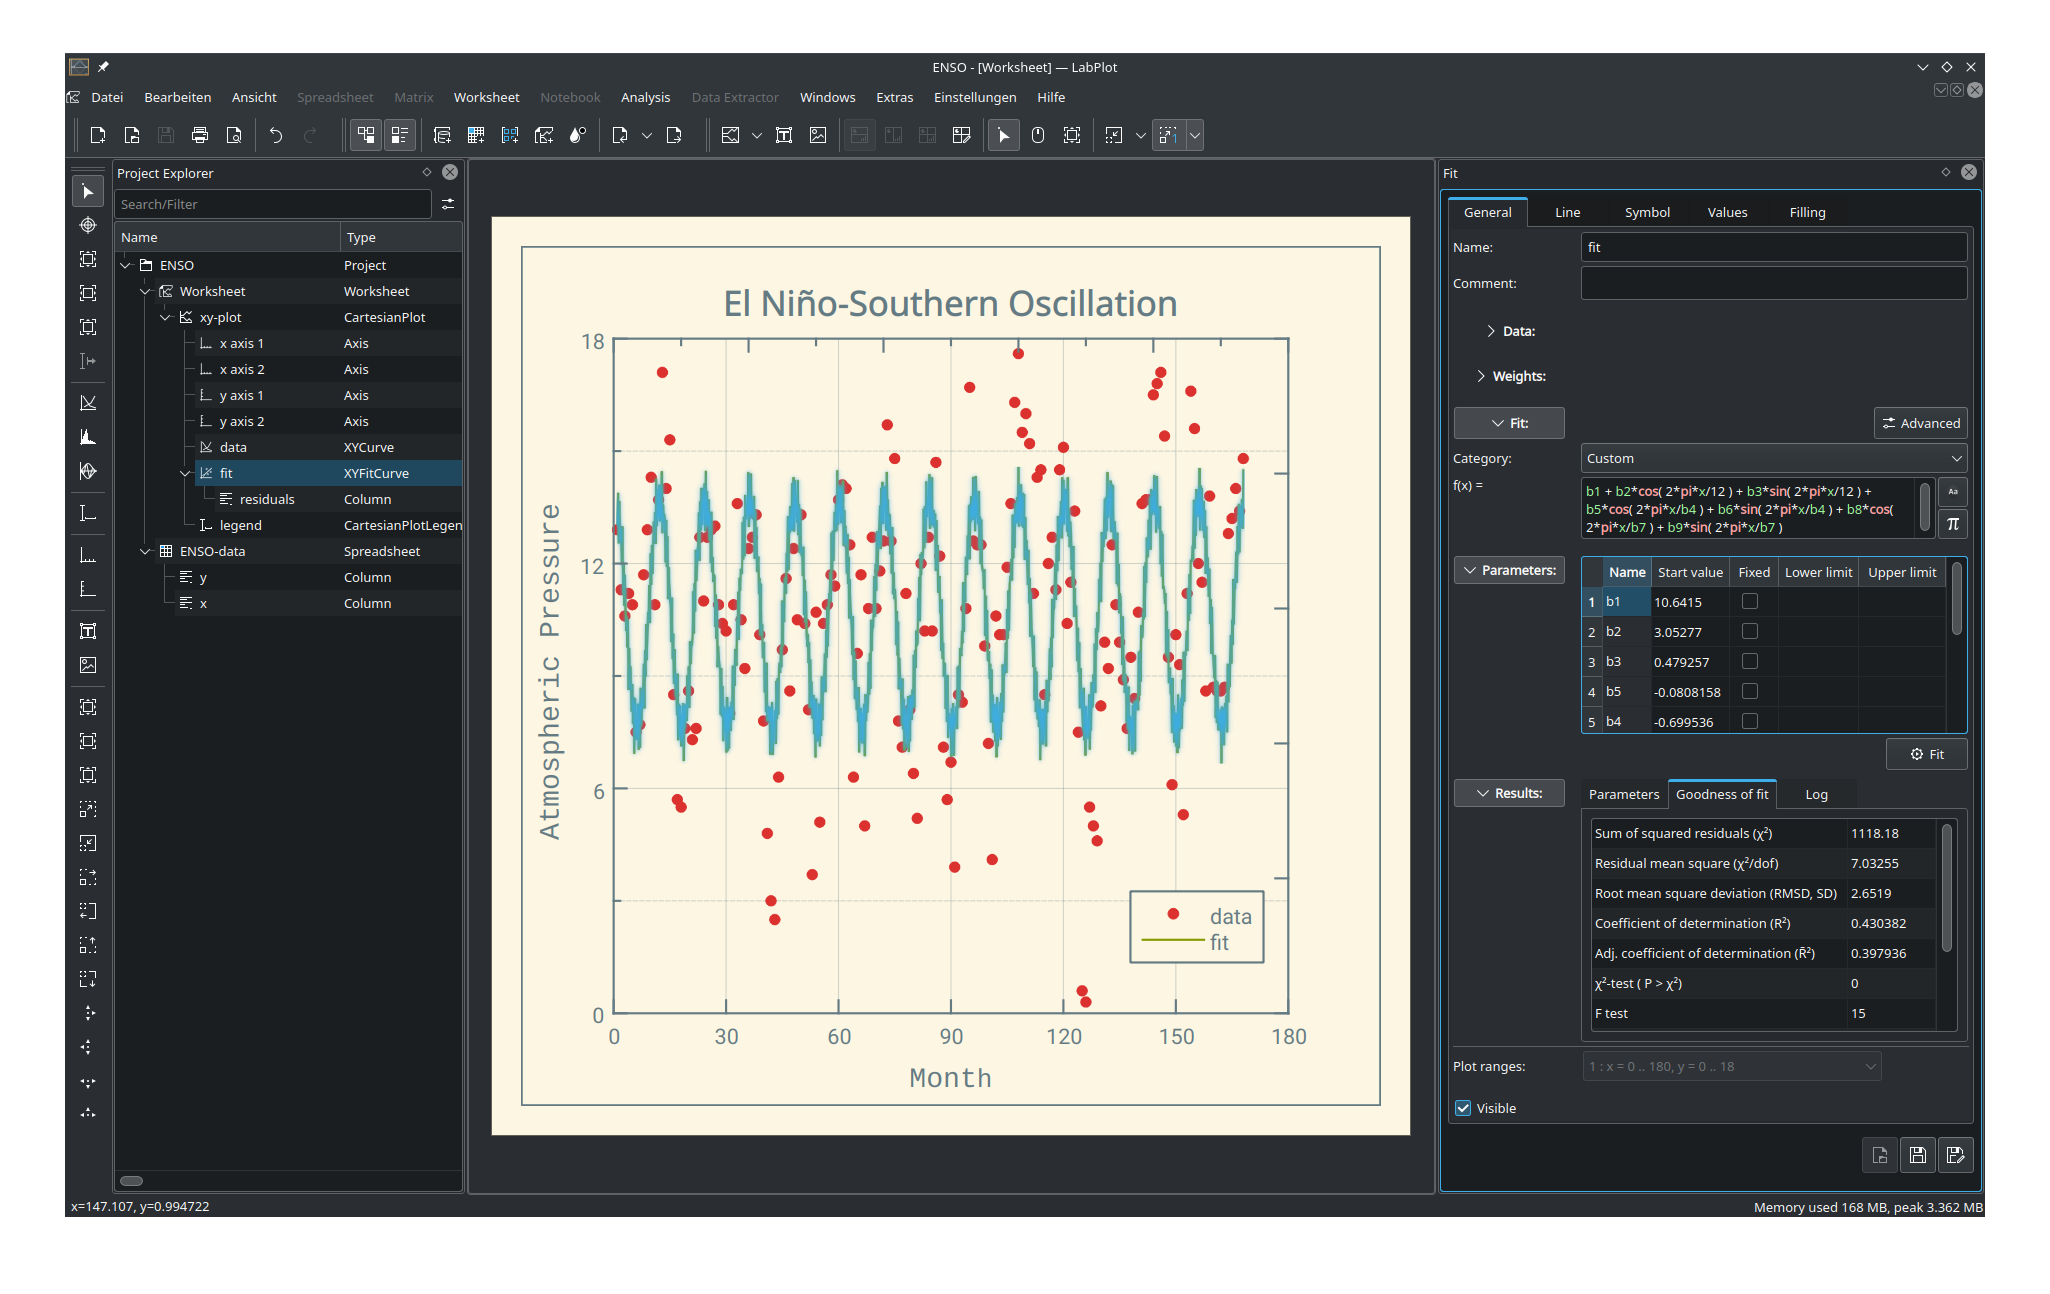
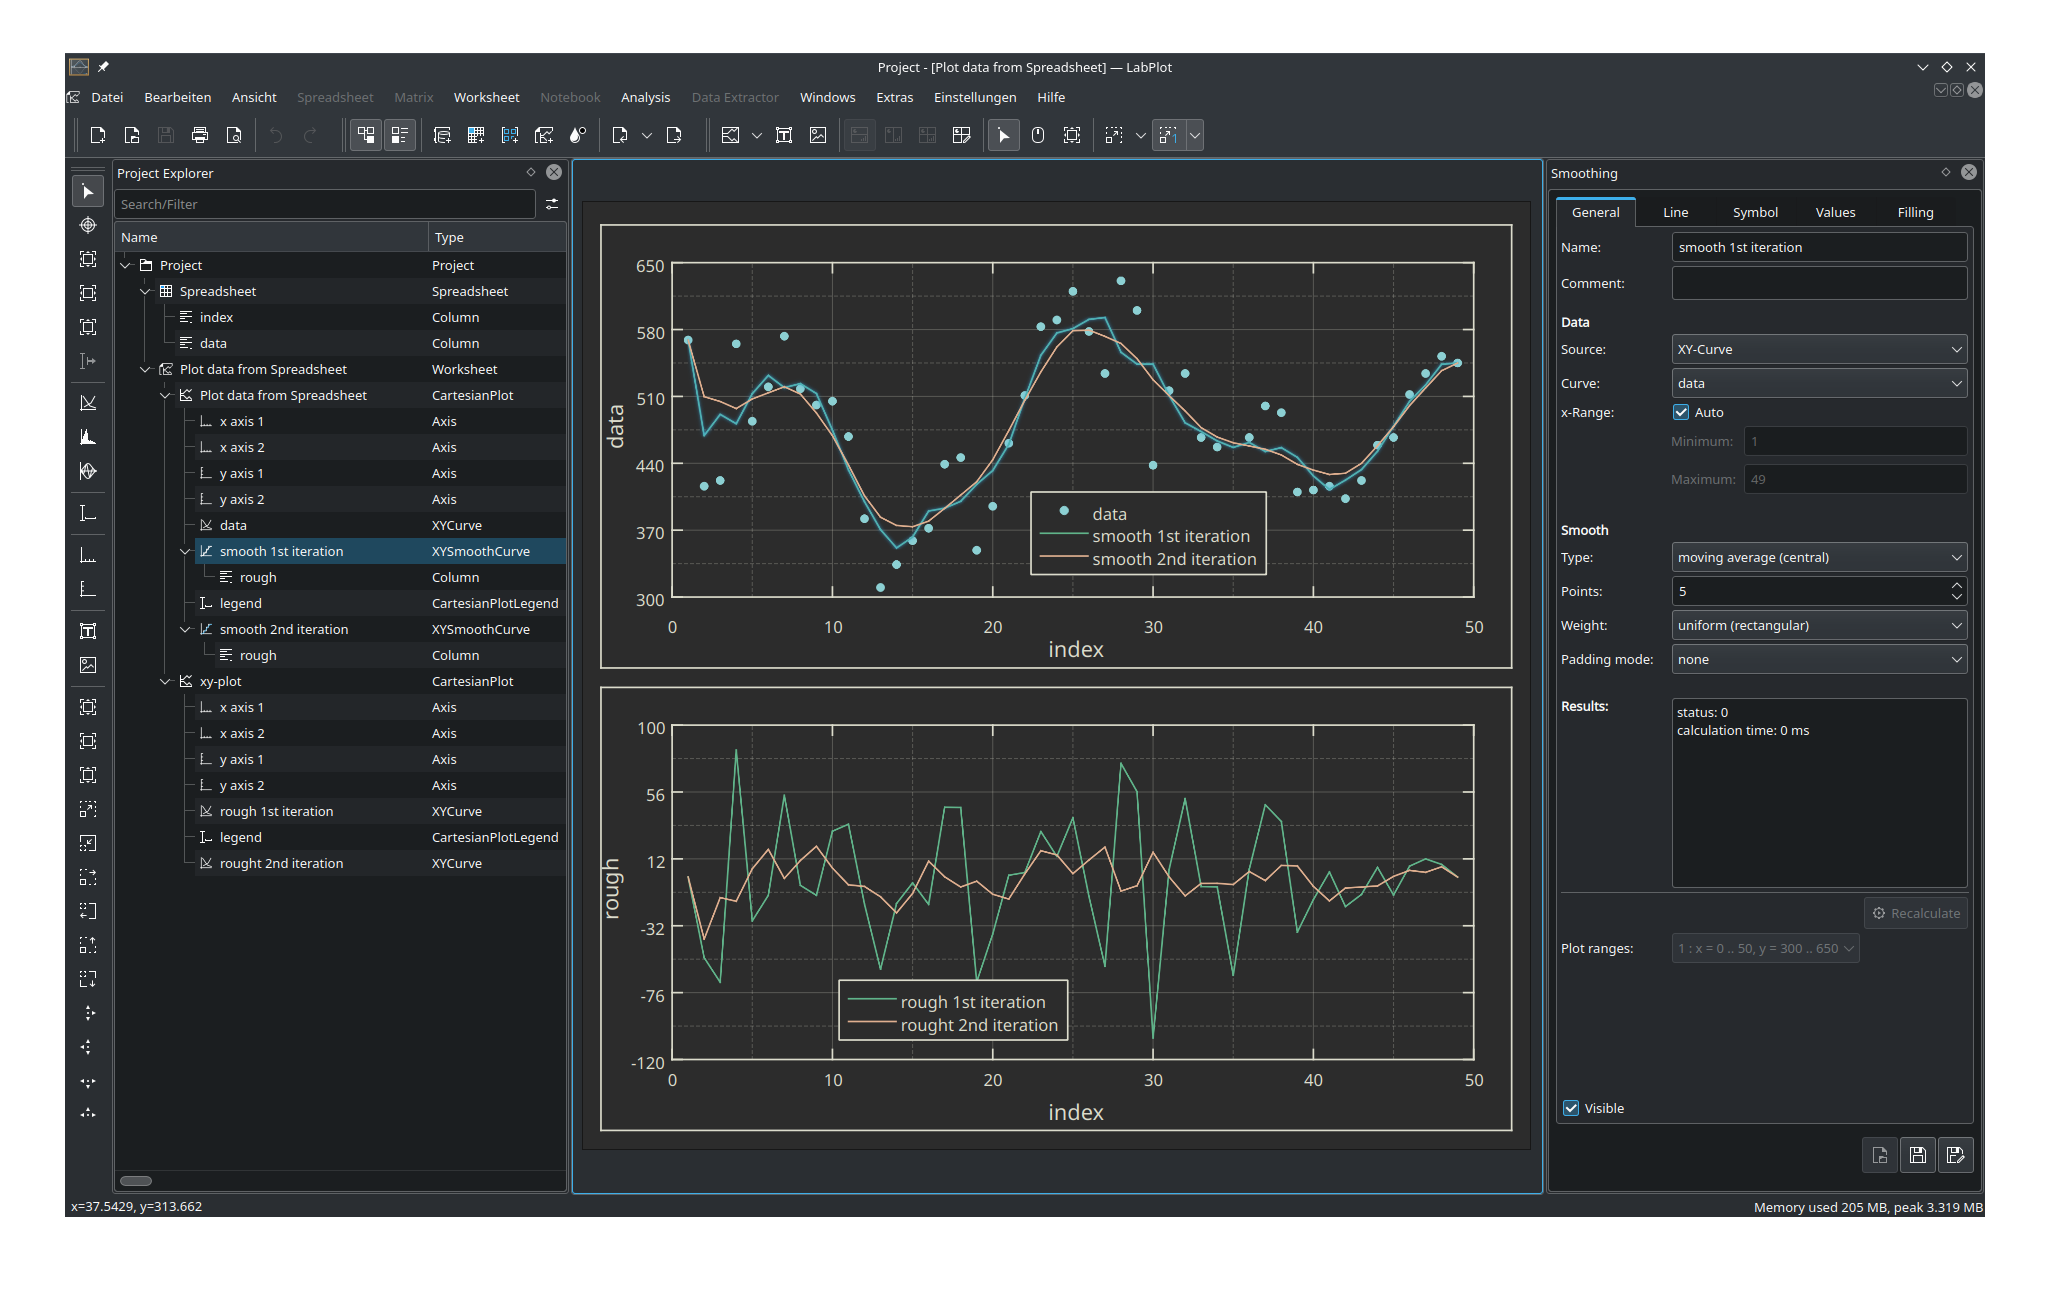
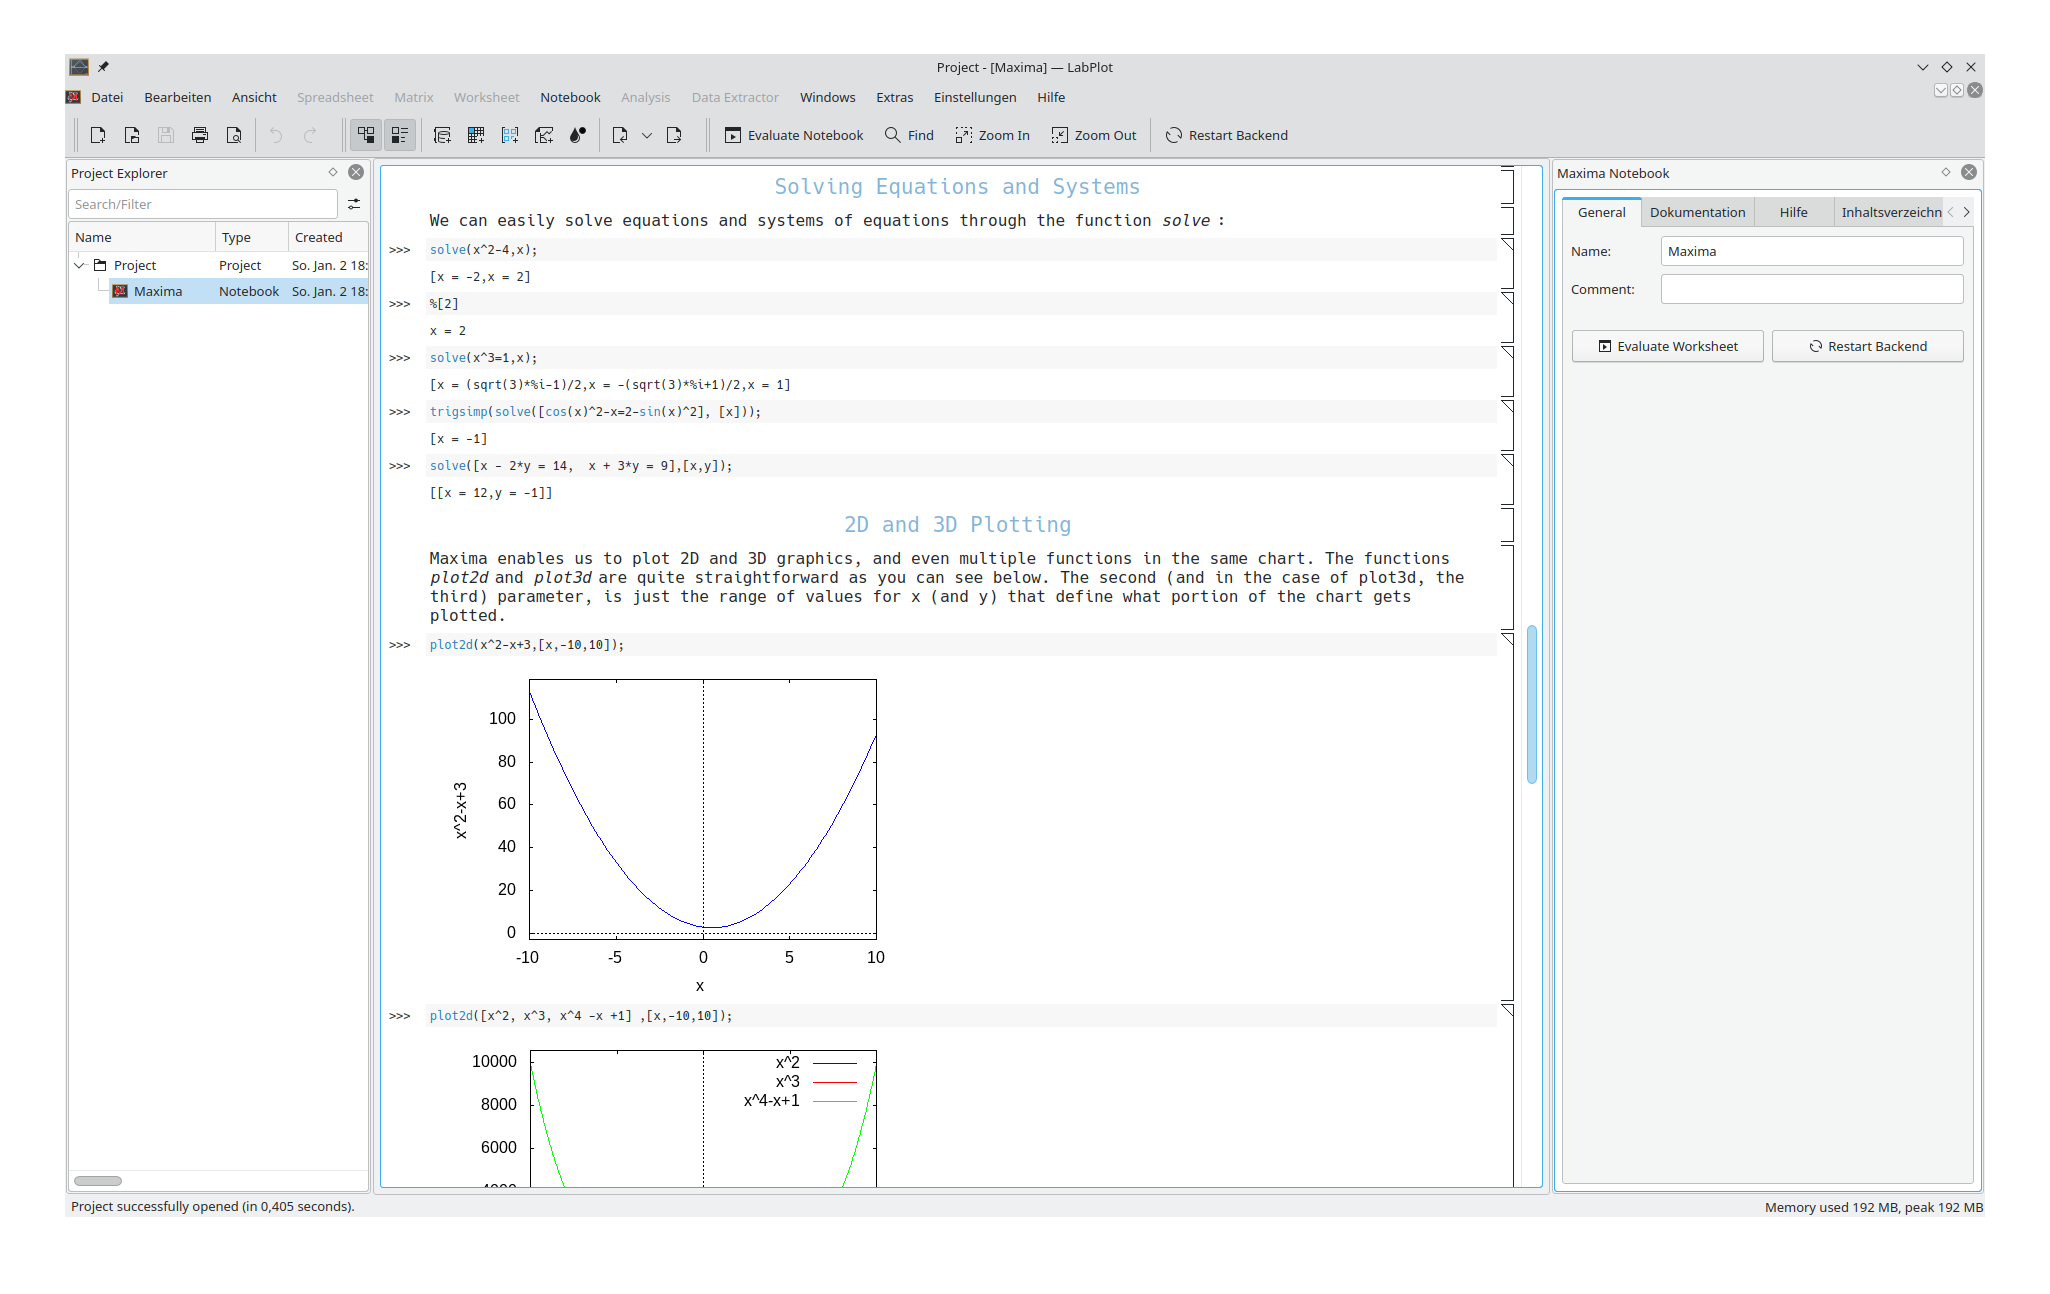
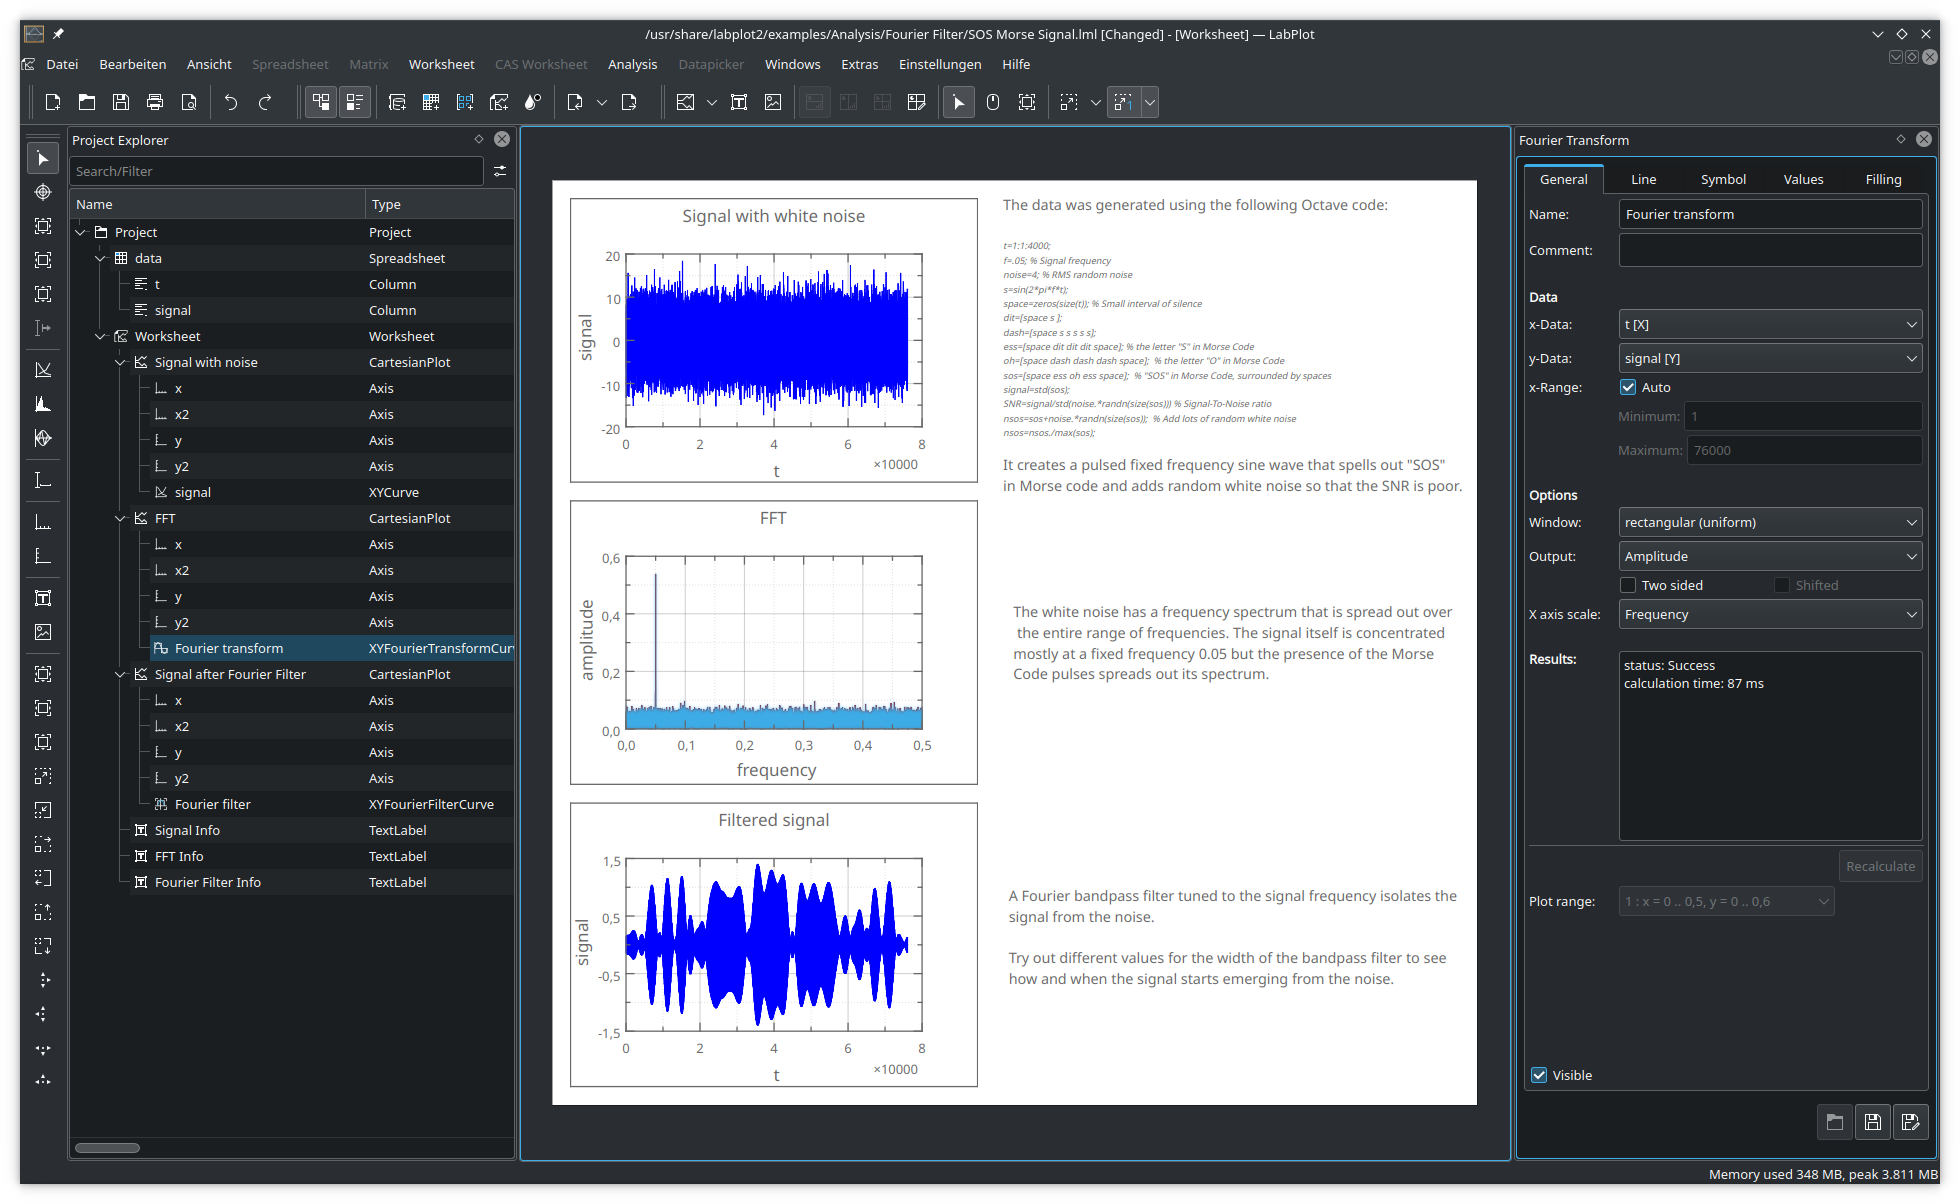
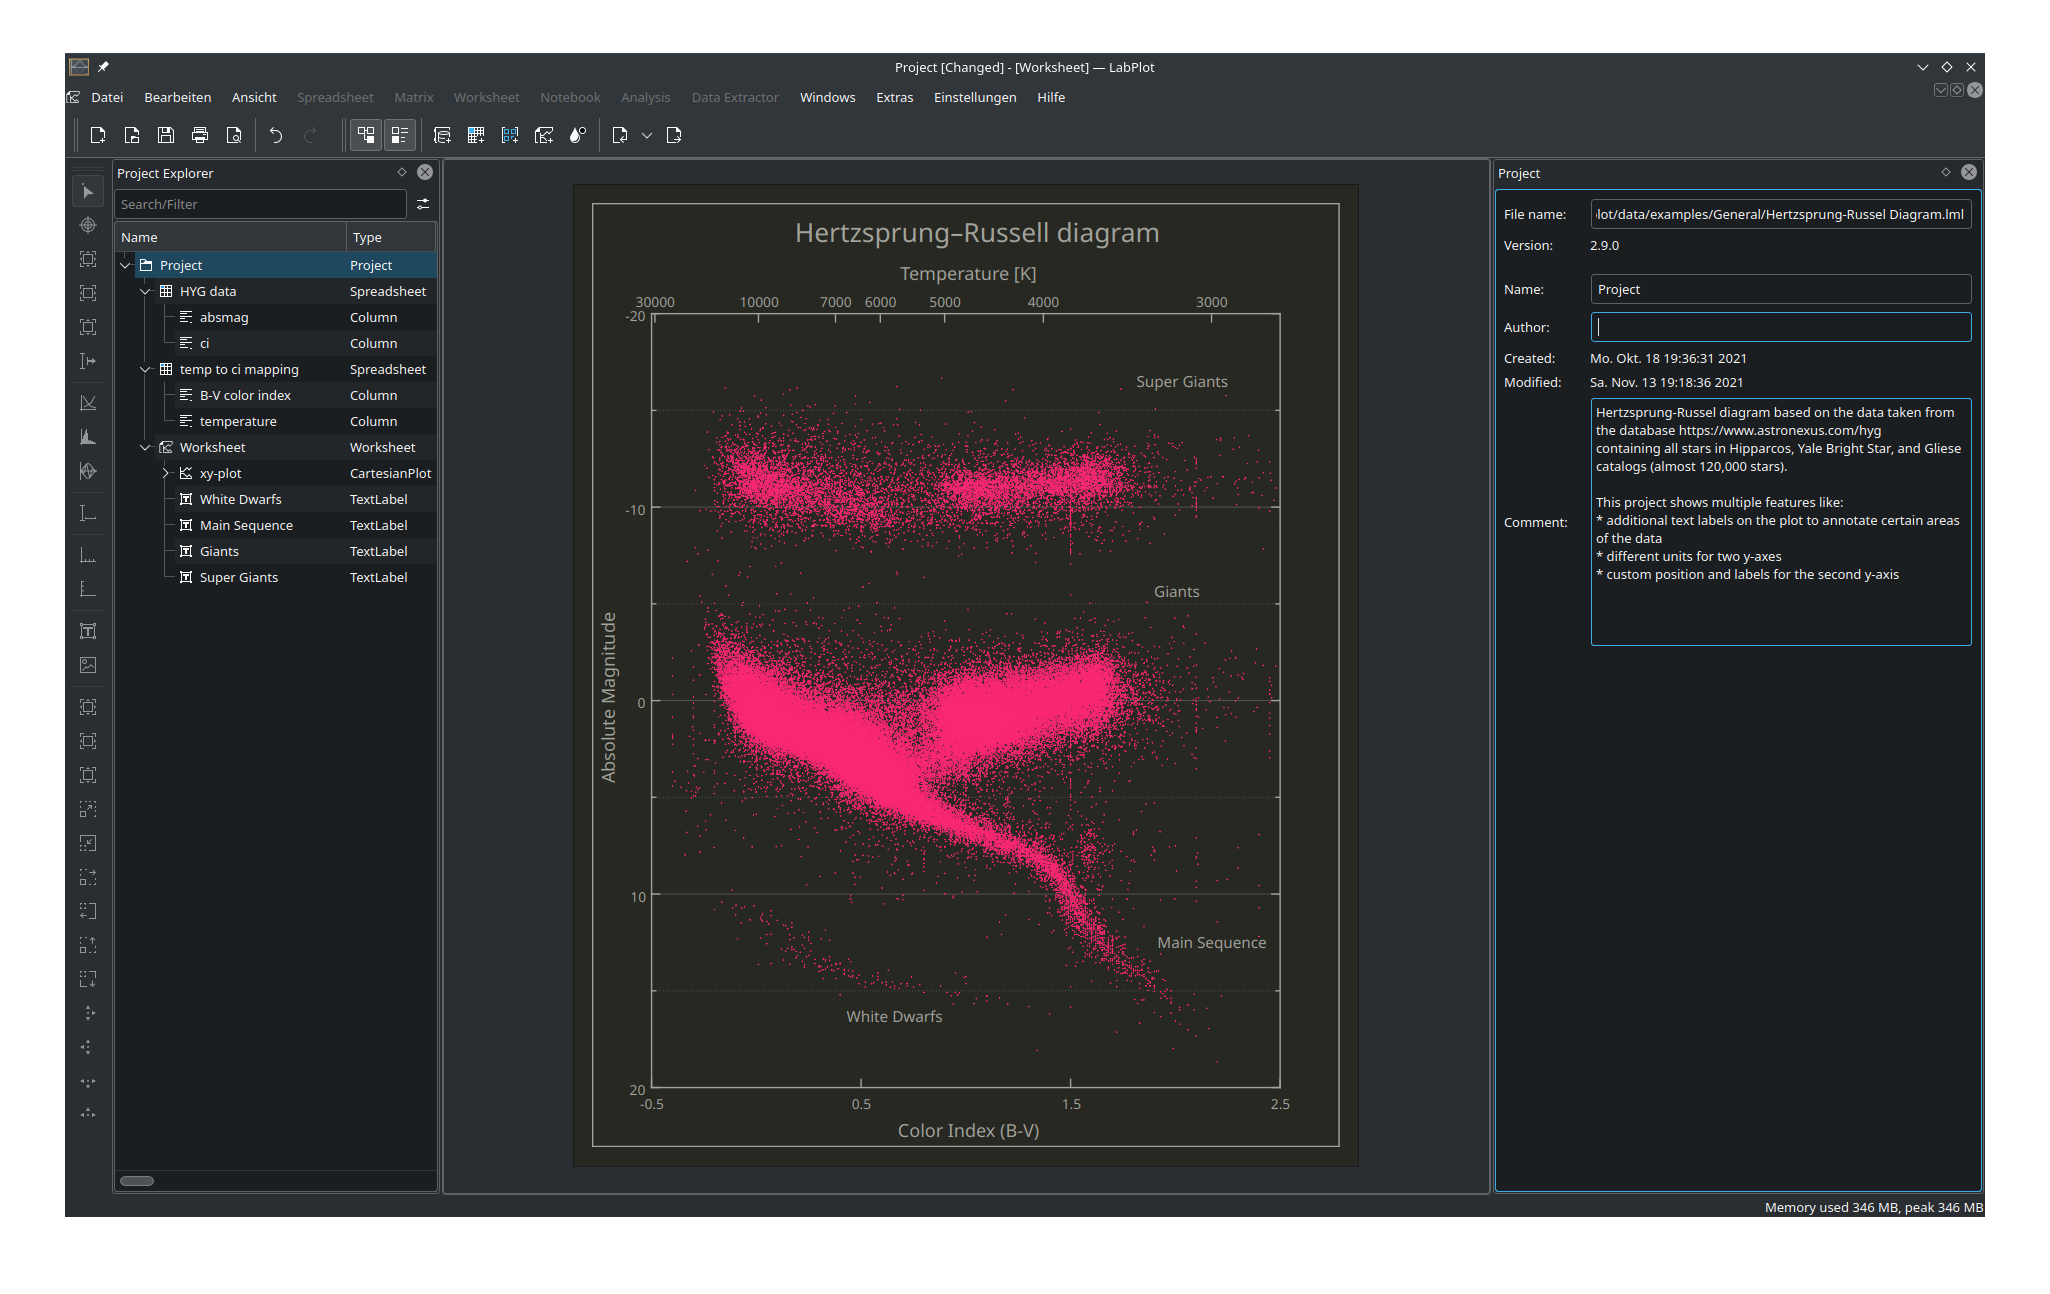
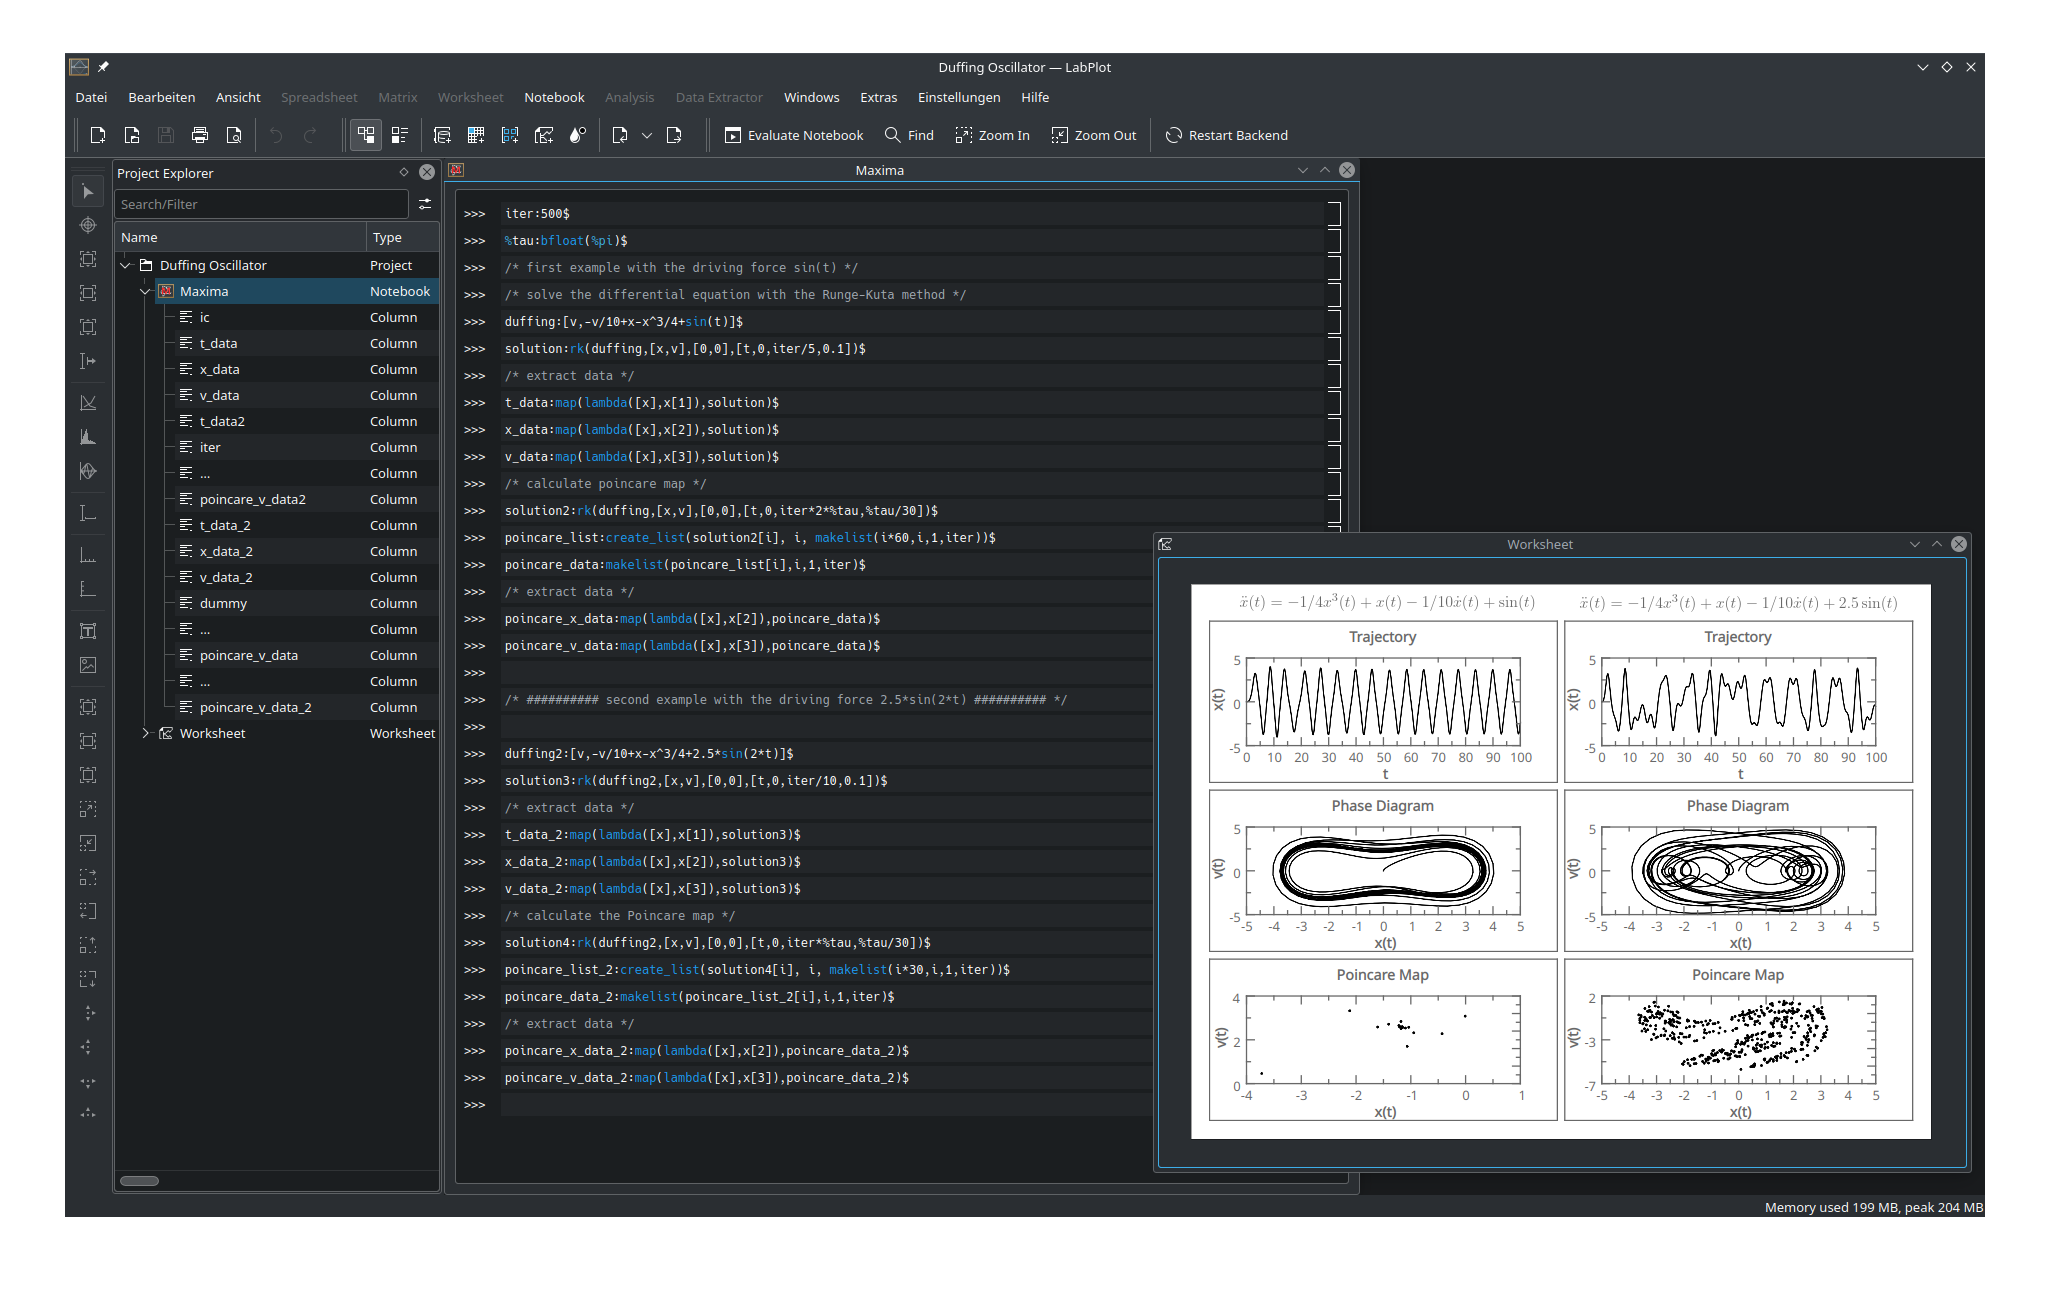
LabPlot es un software LIBERE e gratuite, a fonte aperite e inter-platteforma per Visualisation e Analyse de datos accessibile a omnes.
Labplot forni un modo facile per crear, gerer e modificar tracias (plots). Illo te permitte producer tracias basate sur datos ab un folio electronic o sur datos importate ex files externe. Tracias pote esser exportate a multe formatos de pixmap e vector graphic.

Install on
Linux


Releases RSS
2.11.1
2024-07-16
2.11.0
2024-07-09
2.10.1
2023-07-11
2.10.0
2023-03-21
2.9.0
2022-05-03
2.8.2
2021-04-01
2.8.1
2020-11-13
2.8.0
2020-09-16
Nightly installers
LabPlot nightly installers are also available to download from the KDE CDN. These versions are intended for testing purpose. Get involved and help us make them better!
Unstable version.
Generated from the latest version of the development branch.