KCachegrind
Kategori: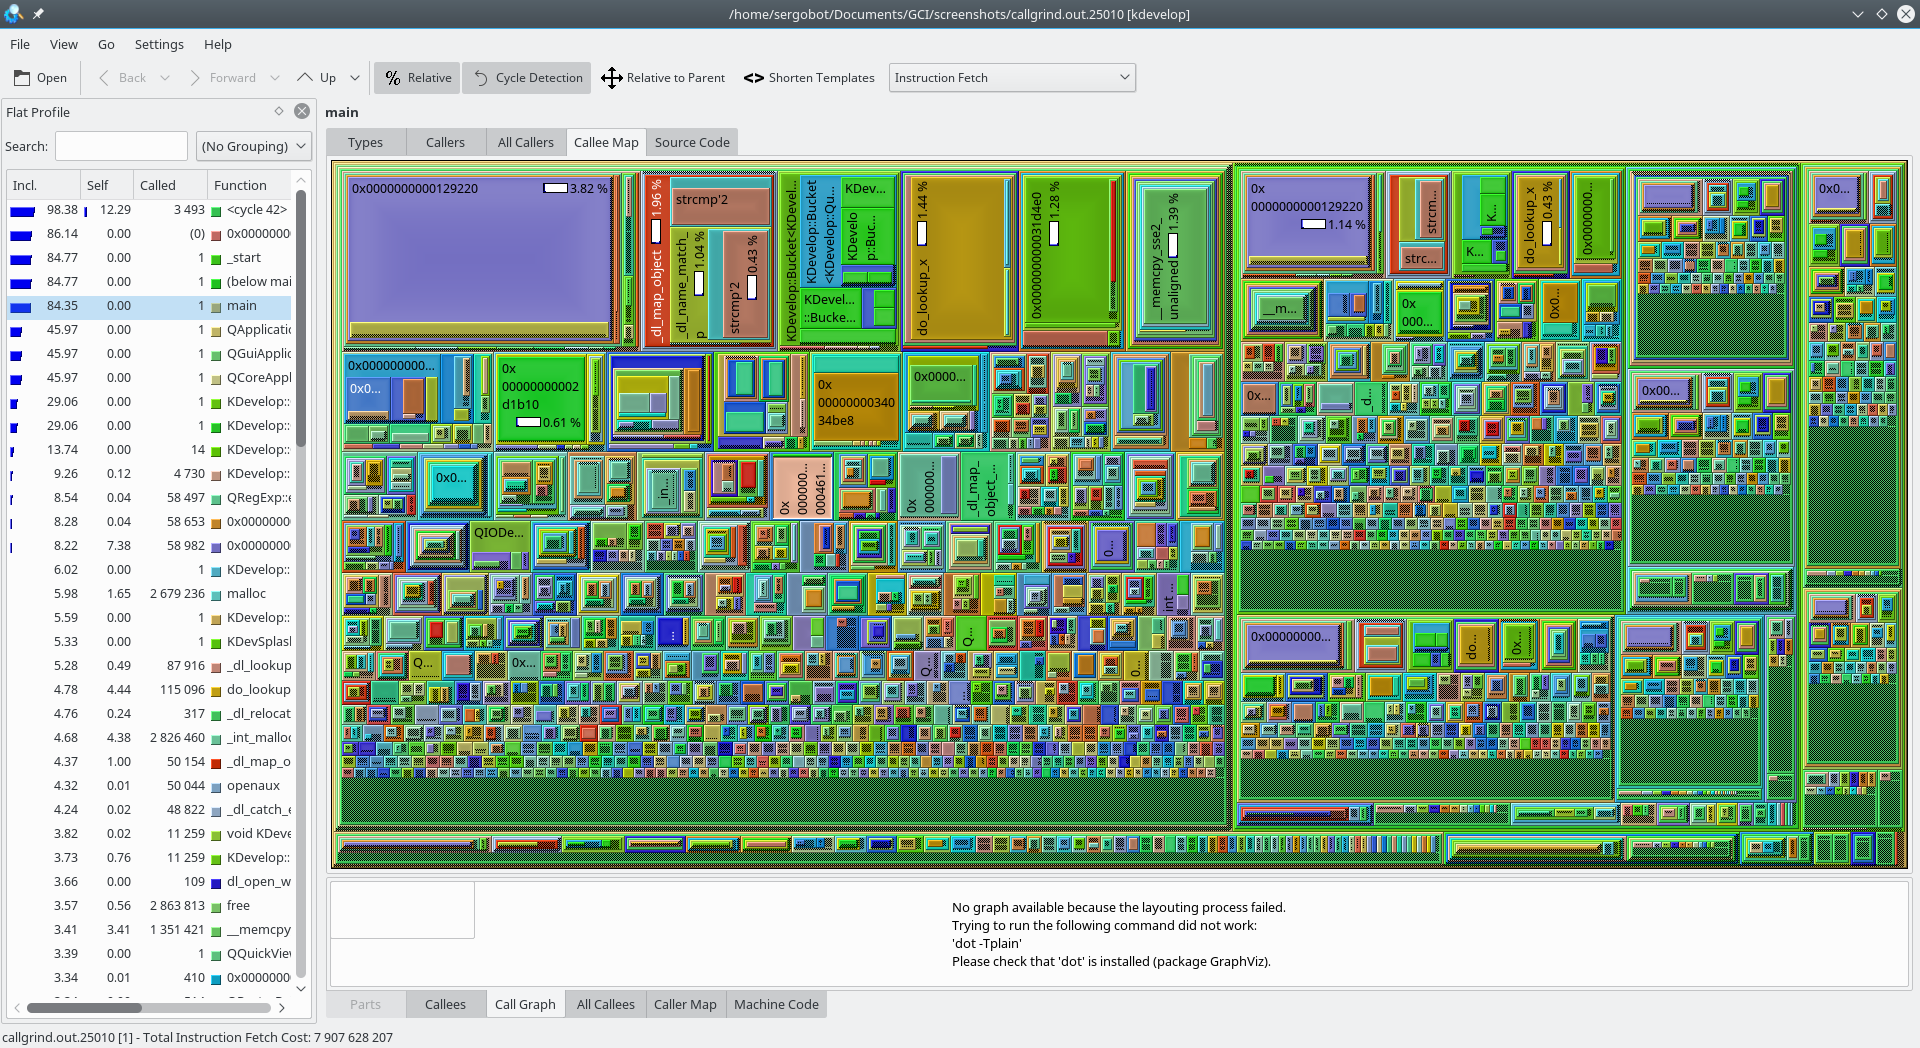
KCachegrind adalah sebuah alat virtualidasi data profil, digunakan untuk menentukan seberapa memakan waktu dalam pengeksekusian program.
Fitur:
- KCachegrind memvisualkan profil (mis. karakteristik runtime) pada aplikasi dalam beberapa cara, termasuk visualisasi grafik panggilan dan anotasi sumber/disassembler.
- Ini bisa memuat profil yang dihasilkan oleh simulasi/panggilan pelacak cache Calltree, alat Valgrind. Dengan demikian, pemprofilan tidak perlu persiapan apa pun, bisa mengatasi pustaka yang di-share dan arsitektur plugin, dan tidaklah mempengaruhi pengukuran itu sendiri.
- Skrip pengkonversi untuk OProfile, Perl, dan PHP
- Peralihan antara tataletak multi visualisasi
- Grafik panggilan bisa diekspor sebagai citra (PNG).
- Displai serempak dari tipe 2 peristiwa dalam Panggilan dan Tampilan Anotasi

Instal di
Linux


Rilisan RSS
26.04.3
2026-07-02
26.04.2
2026-06-04
26.04.1
2026-05-07
26.04.0
2026-04-16
25.12.3
2026-03-05
25.12.2
2026-02-05
25.12.1
2026-01-08
25.12.0
2025-12-11
25.08.3
2025-11-06
25.08.2
2025-10-09
25.08.1
2025-09-11
25.08.0
2025-08-14
25.04.3
2025-07-03
25.04.2
2025-06-05
25.04.1
2025-05-08
25.04.0
2025-04-17
24.12.3
2025-03-06
24.12.2
2025-02-06
24.12.1
2025-01-09
24.12.0
2024-12-12
24.08.3
2024-11-07
24.08.2
2024-10-10
24.08.1
2024-09-12
24.08.0
2024-08-22
24.05.2
2024-07-04
24.05.1
2024-06-13
24.05.0
2024-05-23
24.02.2
2024-04-11
24.02.1
2024-03-21
24.02.0
2024-02-28
23.08.5
2024-02-15