KCachegrind
분류: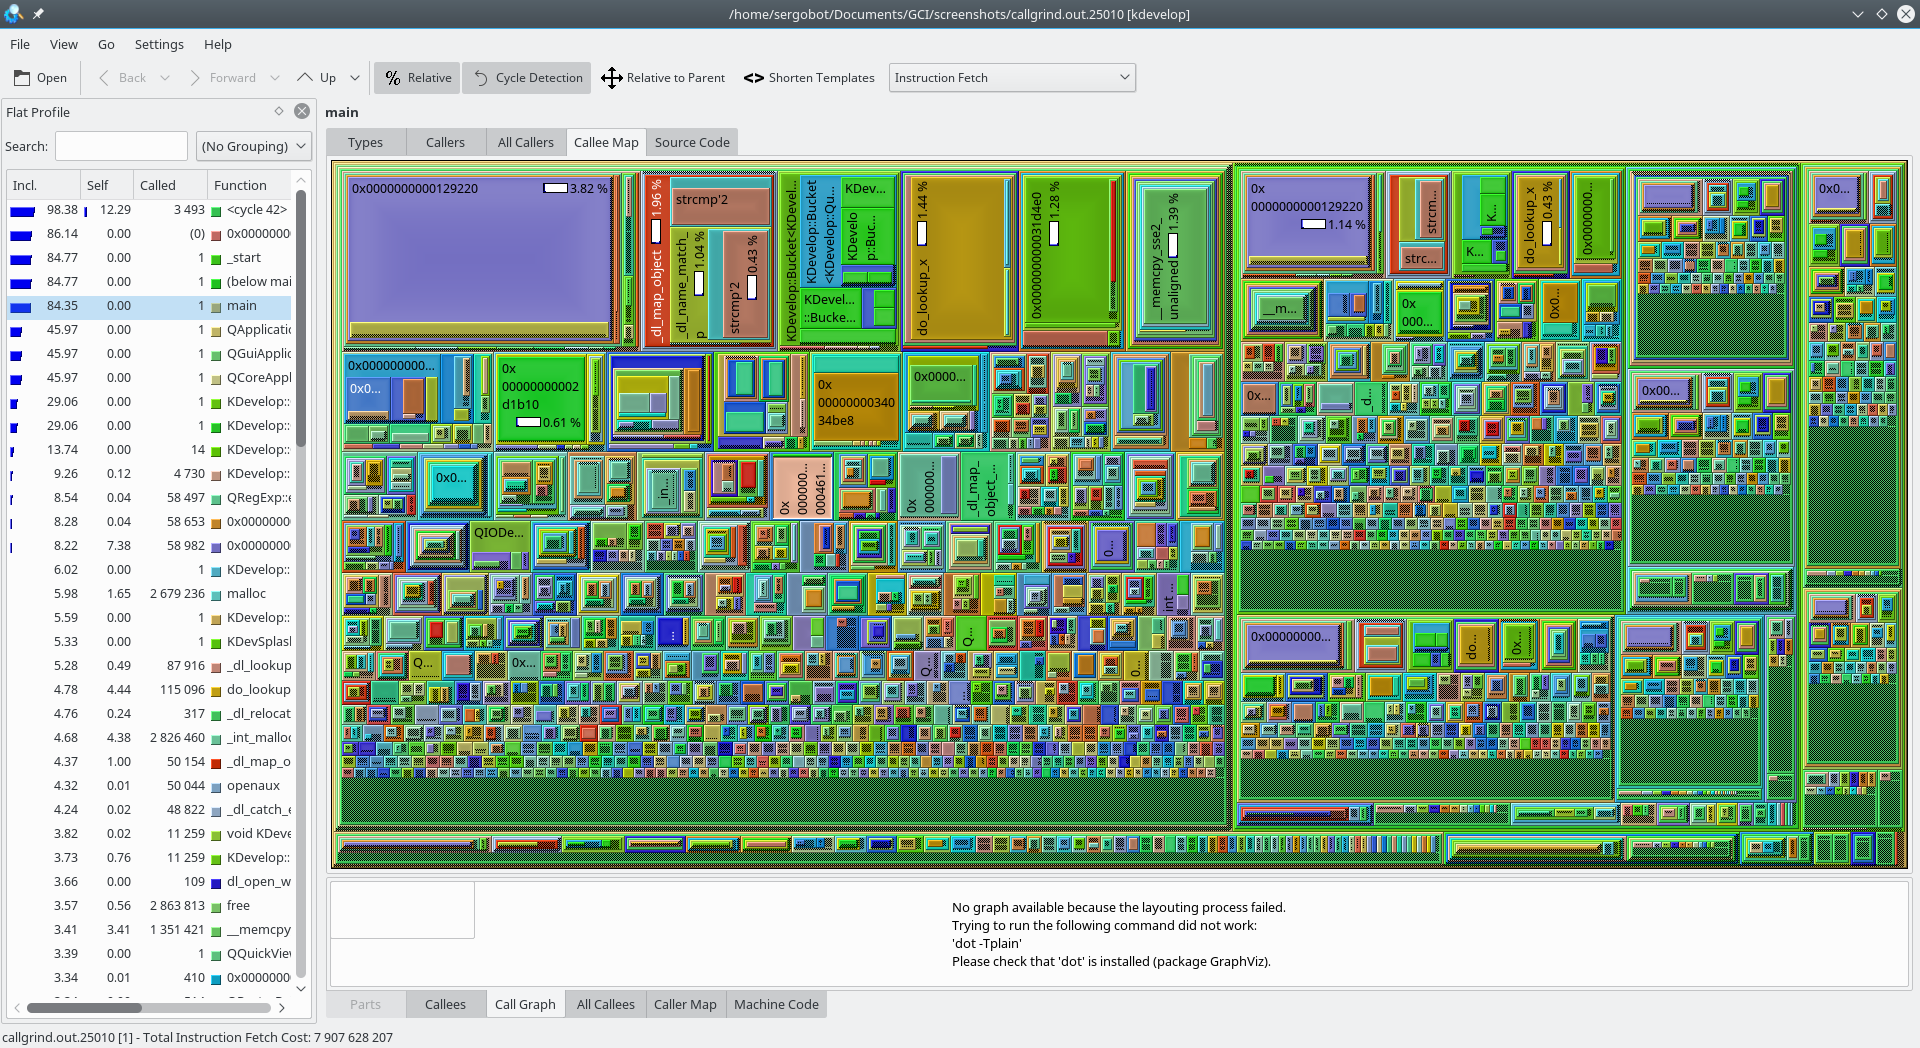
KCachegrind는 프로그램을 프로파일링하여 실행 시간의 가장 많은 부분을 차지하는 항목을 찾습니다.
기능:
- KCachegrind는 호출 그래프 시각화, 소스 코드/어셈블리 코드 표시 등 앱 프로필을 다양하게 시각화합니다.
- Valgrind 도구인 캐시 시뮬레이션/호출 추적기 Calltree의 프로필을 불러올 수 있습니다. 프로파일링 시 별도의 준비 과정이 필요하지 않으며, 공유 라이브러리 및 플러그인으로도 사용할 수 있으며, 측정에 영향을 주지 않습니다.
- OPropile, Perl, PHP 변환 스크립트.
- 여러 시각화 레이아웃 변경.
- 호출 그래프를 그림 파일(PNG)로 내보내기.
- 호출 및 자세한 보기에서 이벤트 형식 두 개 같이 표시


릴리스 RSS
26.04.3
2026-07-02
26.04.2
2026-06-04
26.04.1
2026-05-07
26.04.0
2026-04-16
25.12.3
2026-03-05
25.12.2
2026-02-05
25.12.1
2026-01-08
25.12.0
2025-12-11
25.08.3
2025-11-06
25.08.2
2025-10-09
25.08.1
2025-09-11
25.08.0
2025-08-14
25.04.3
2025-07-03
25.04.2
2025-06-05
25.04.1
2025-05-08
25.04.0
2025-04-17
24.12.3
2025-03-06
24.12.2
2025-02-06
24.12.1
2025-01-09
24.12.0
2024-12-12
24.08.3
2024-11-07
24.08.2
2024-10-10
24.08.1
2024-09-12
24.08.0
2024-08-22
24.05.2
2024-07-04
24.05.1
2024-06-13
24.05.0
2024-05-23
24.02.2
2024-04-11
24.02.1
2024-03-21
24.02.0
2024-02-28
23.08.5
2024-02-15