Hopp til innhaldet

LabPlot

Kategoriar:   Utdanning Andre plattformer:   Windows
Basic visualization of data
Advanced layouting of plots and images
Theming
Visualization of mathematical functions
Fit pre-defined or custom models to the data
Smooth the data with the help of various smoothing methods
Notebook interface for interactive sessions in Maxima, Octave, R, Sage, Scilab, Python, Julia, etc
Signal analysis
Herzsprung-Russel diagram in LabPlot
Visualization of data calculated in an interactive Maxima session

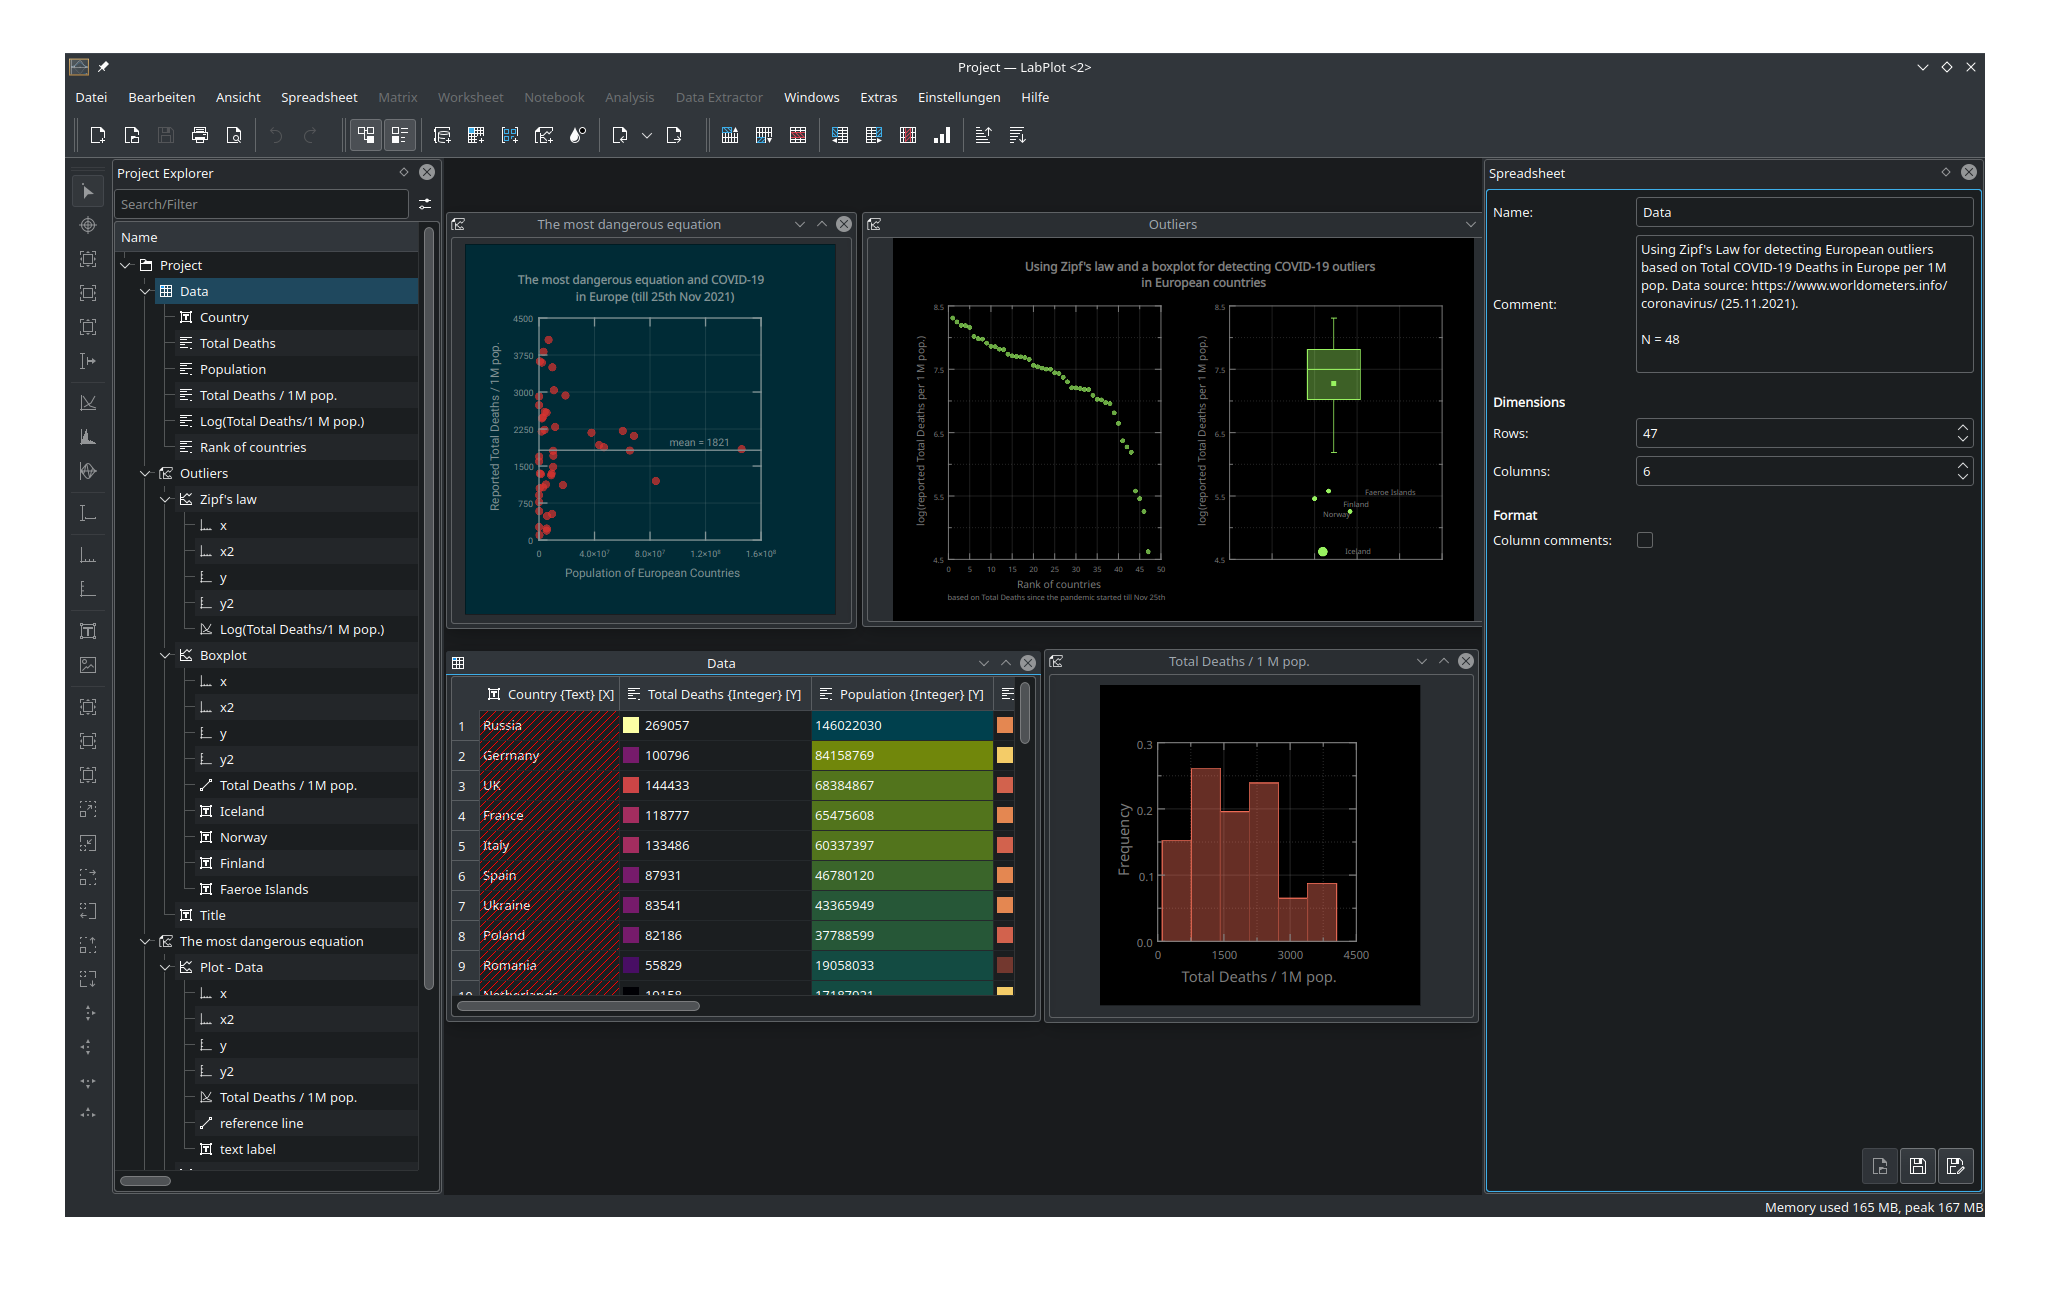
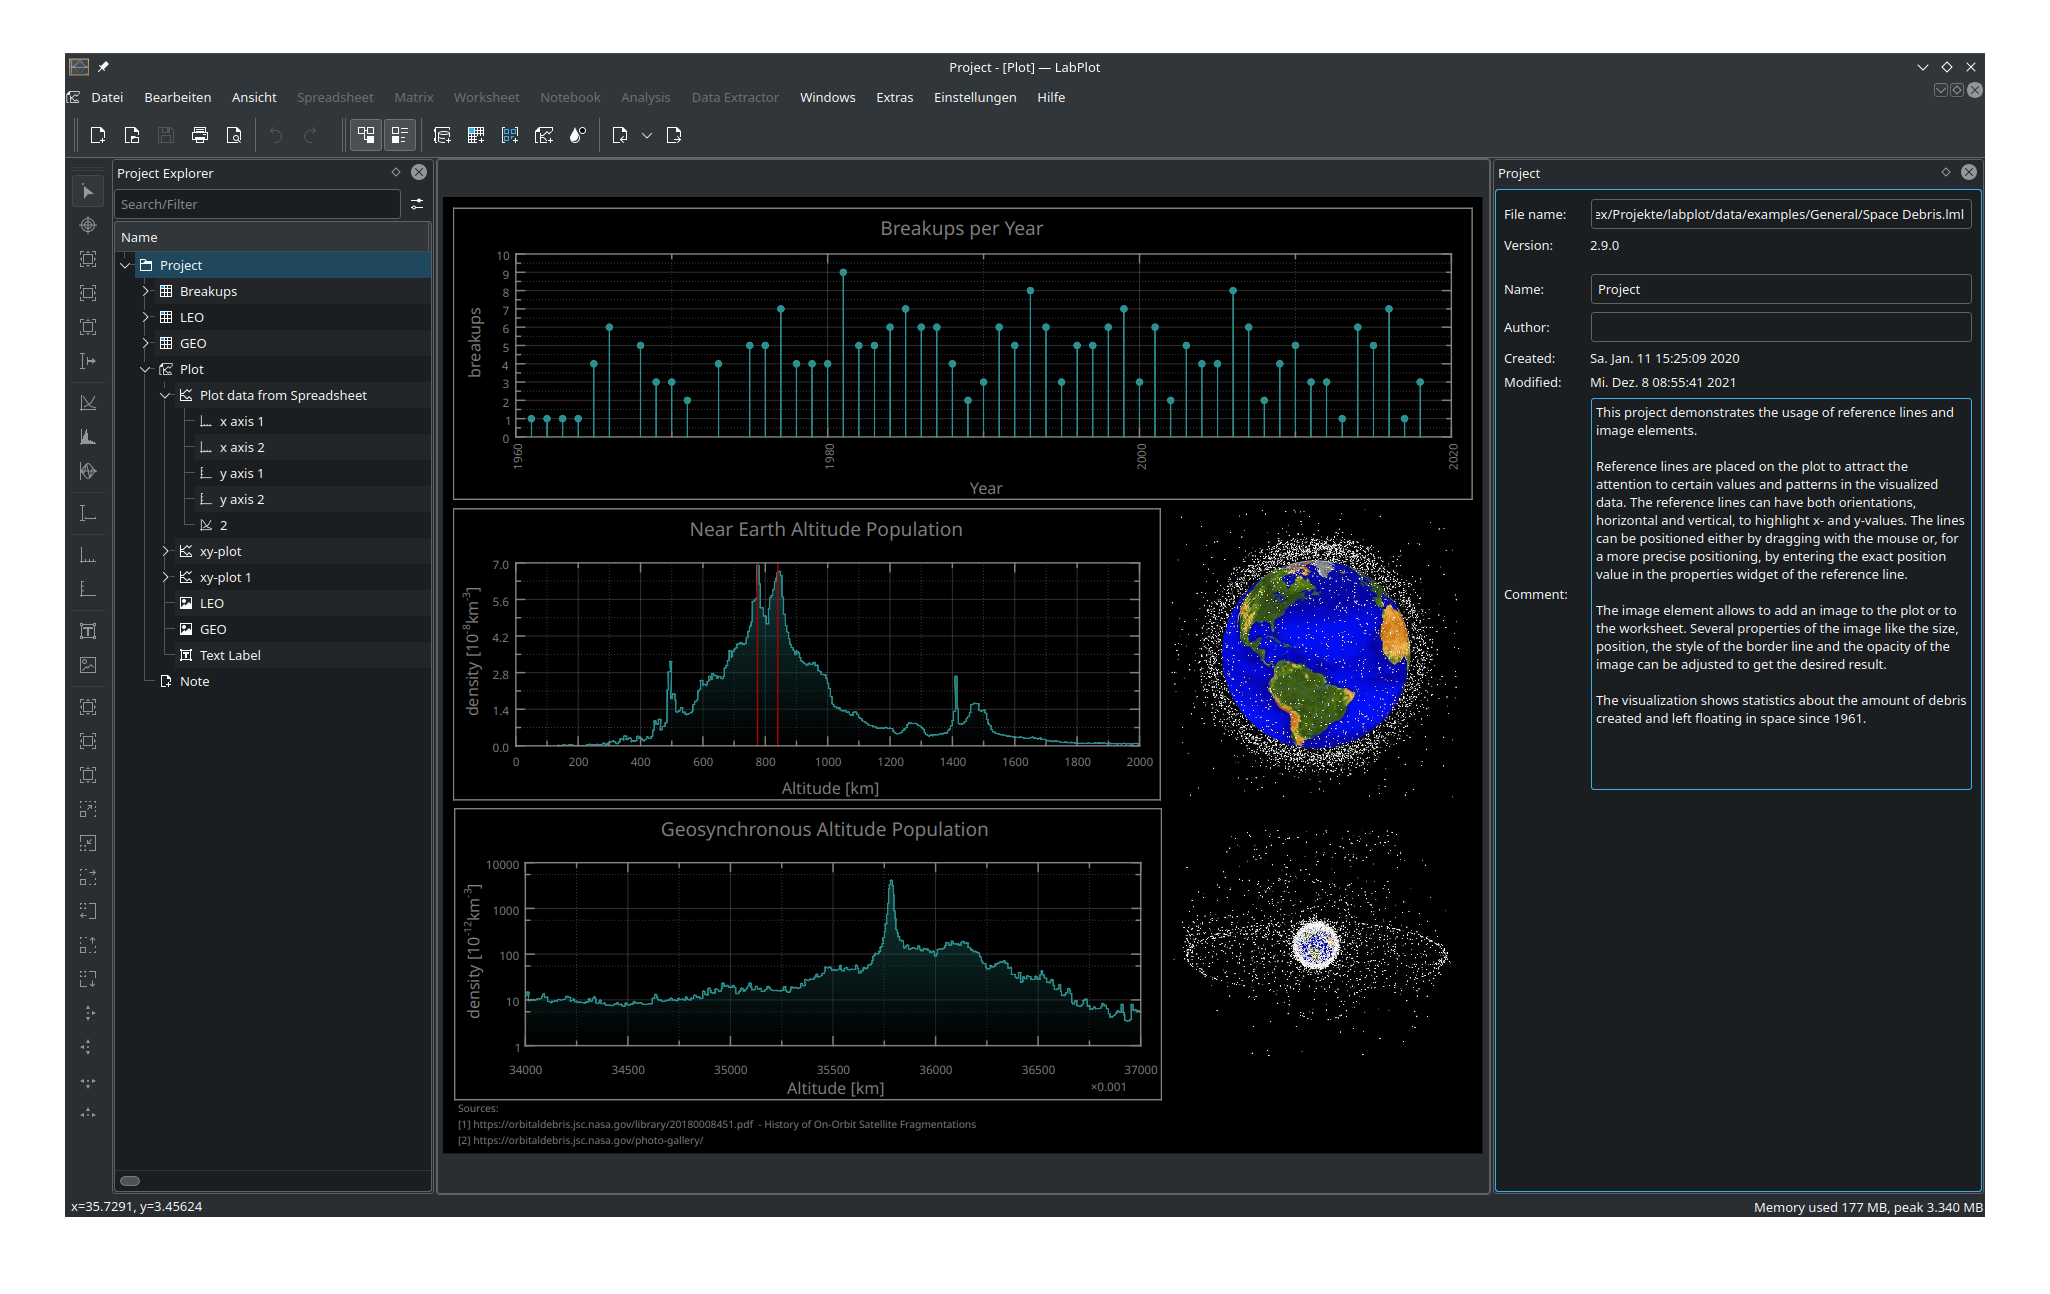
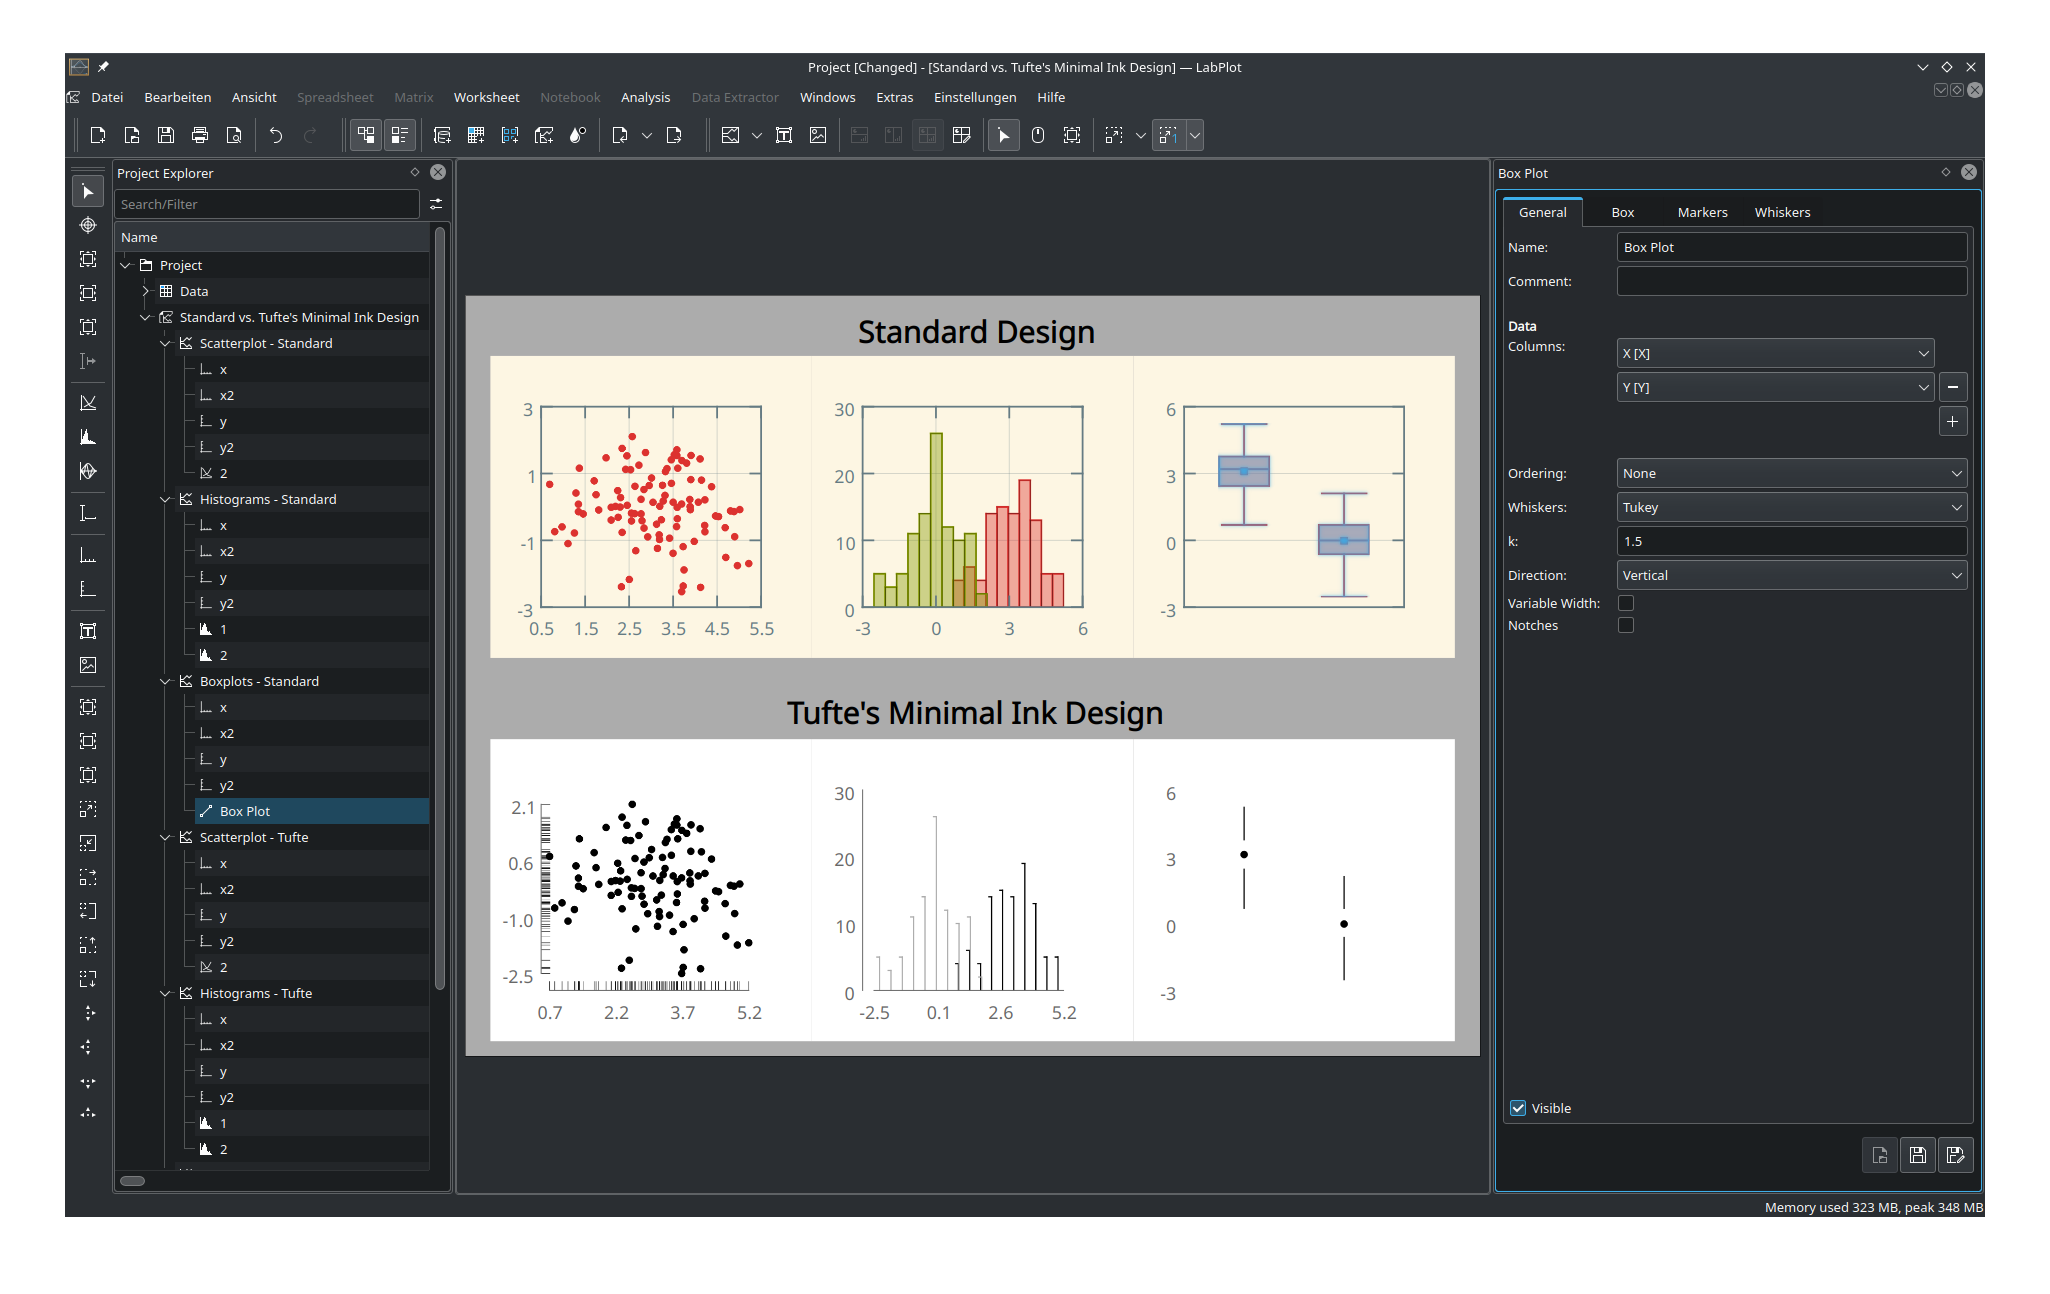
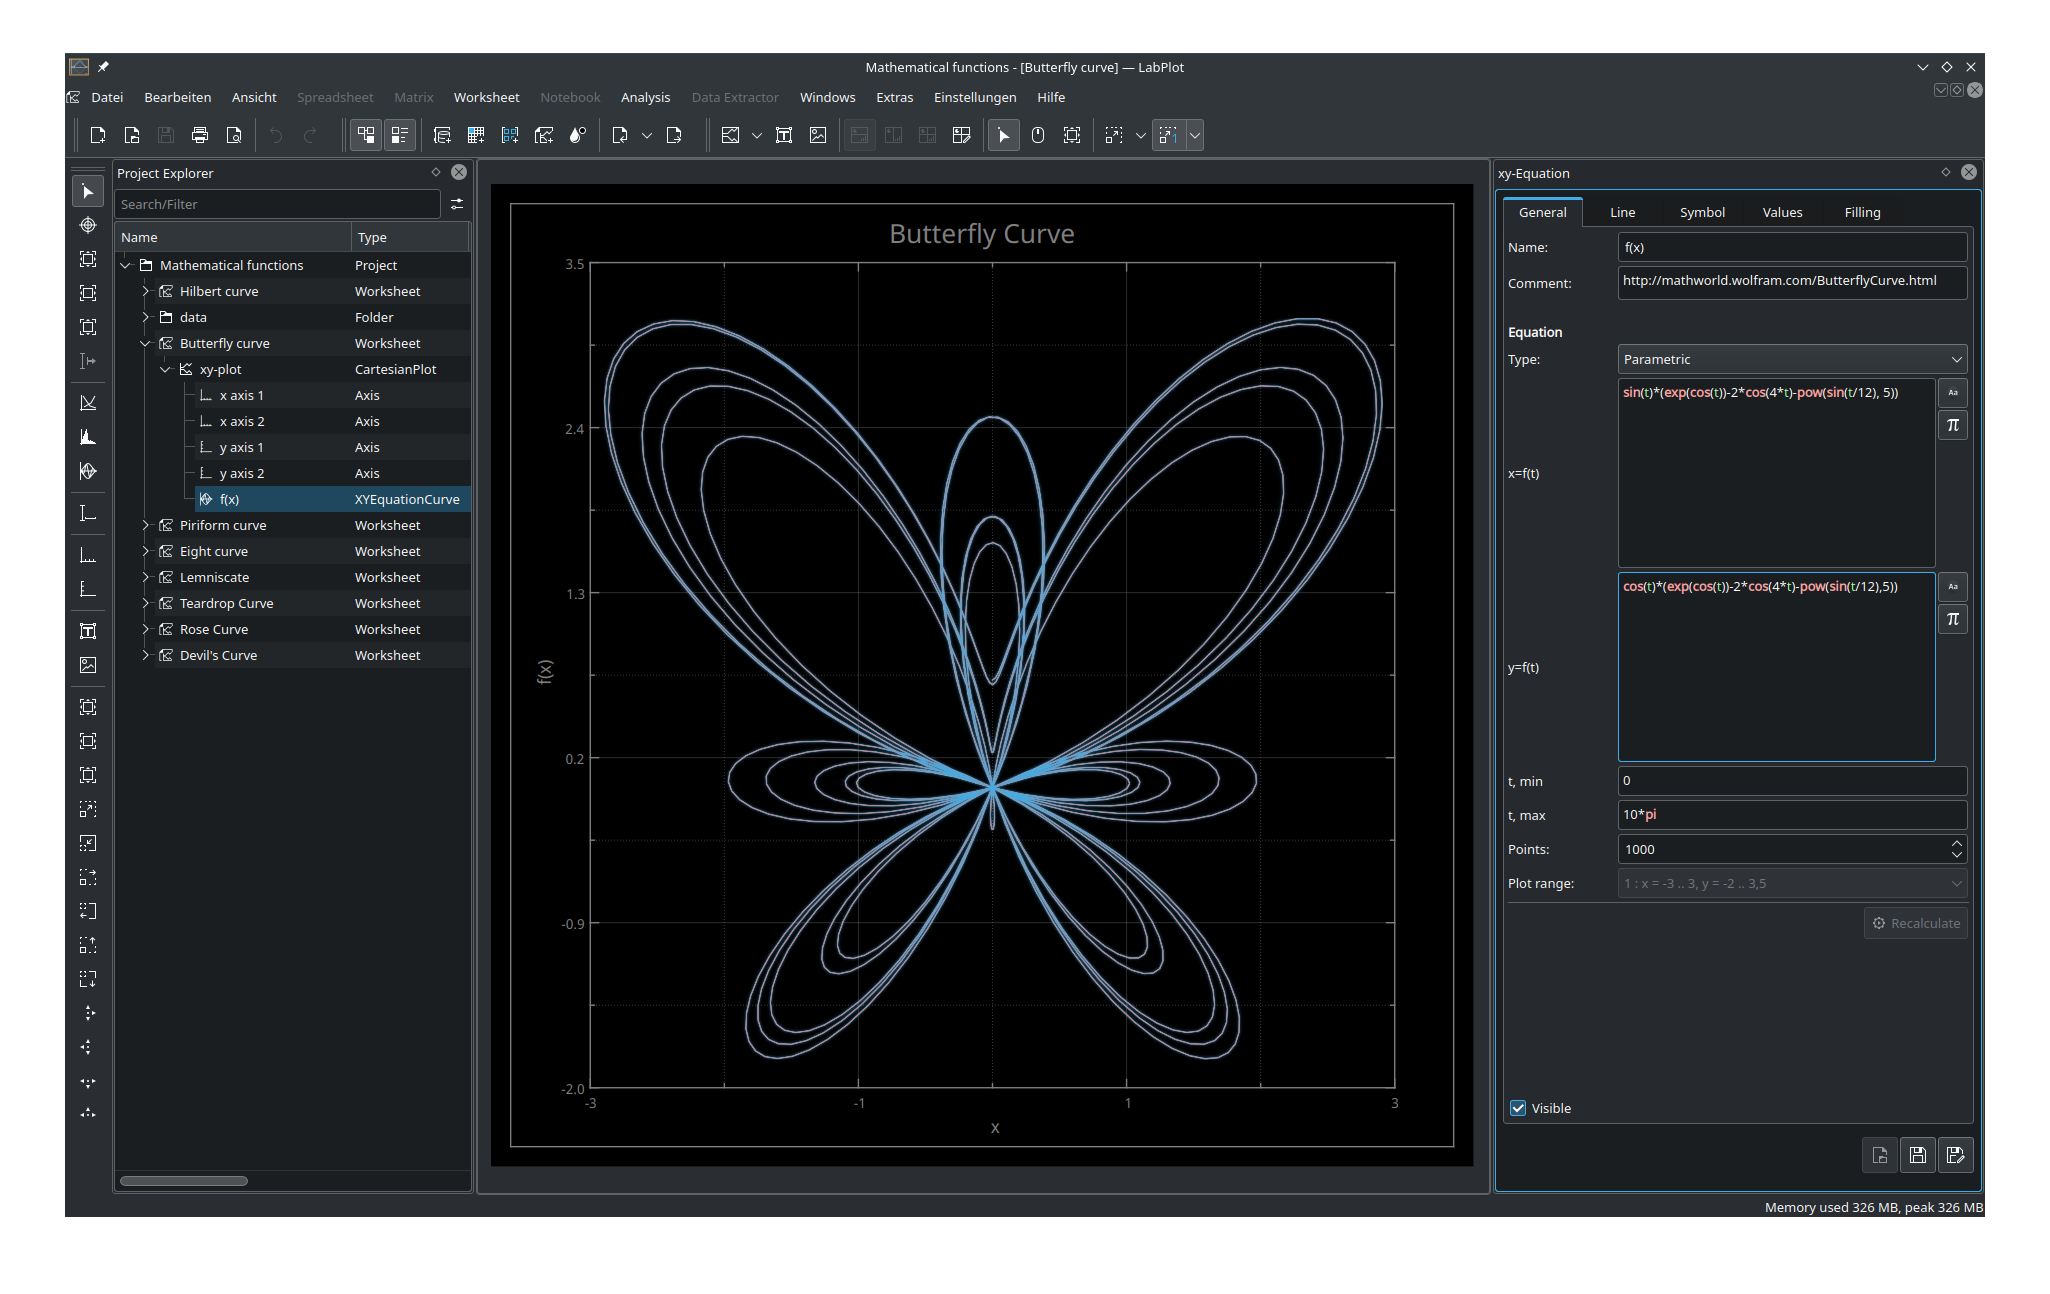
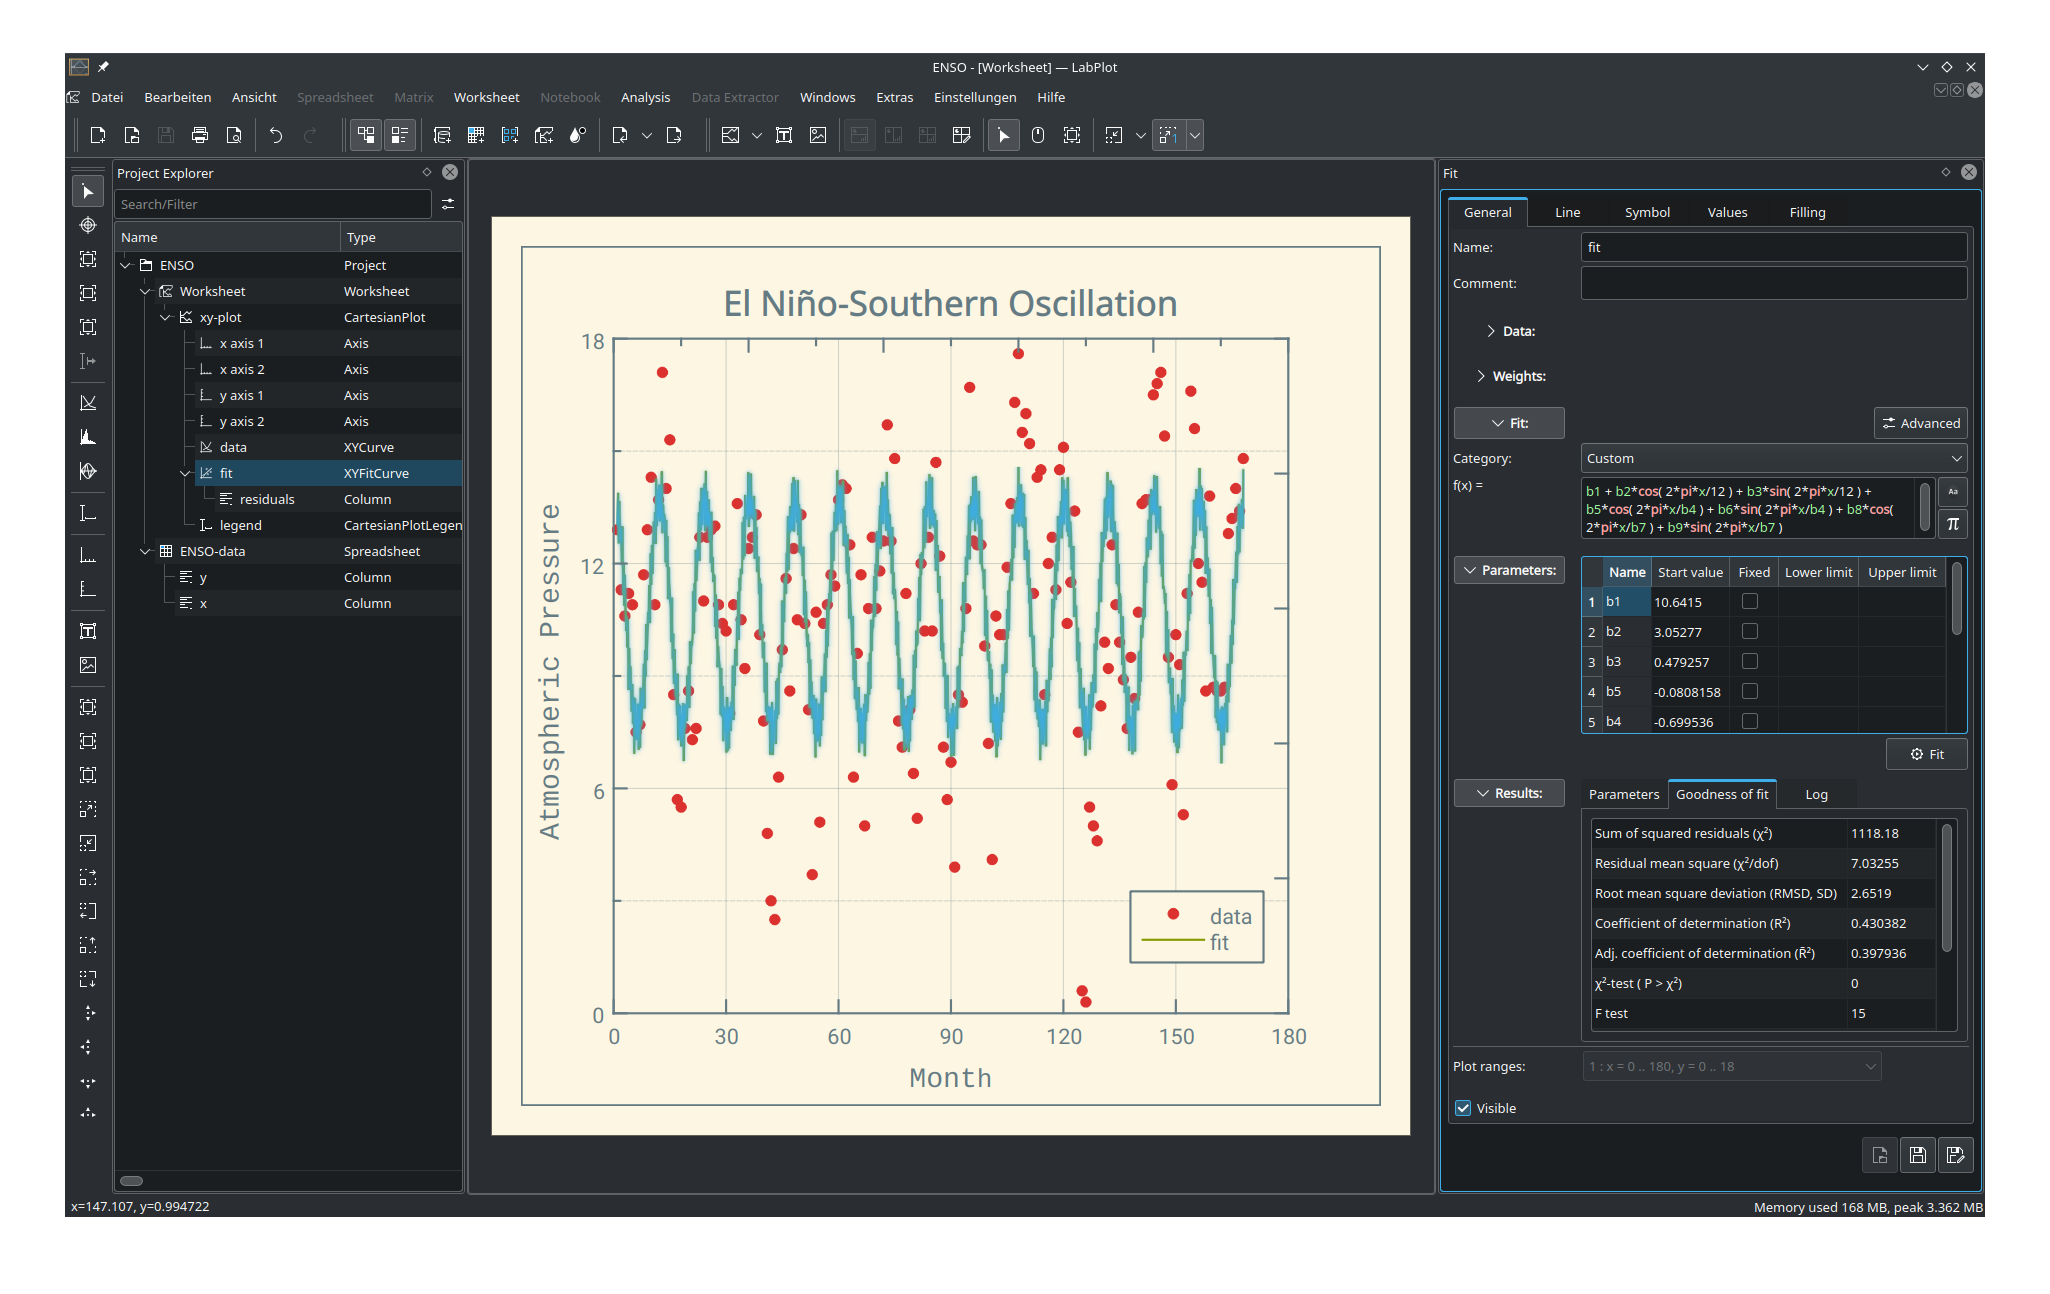
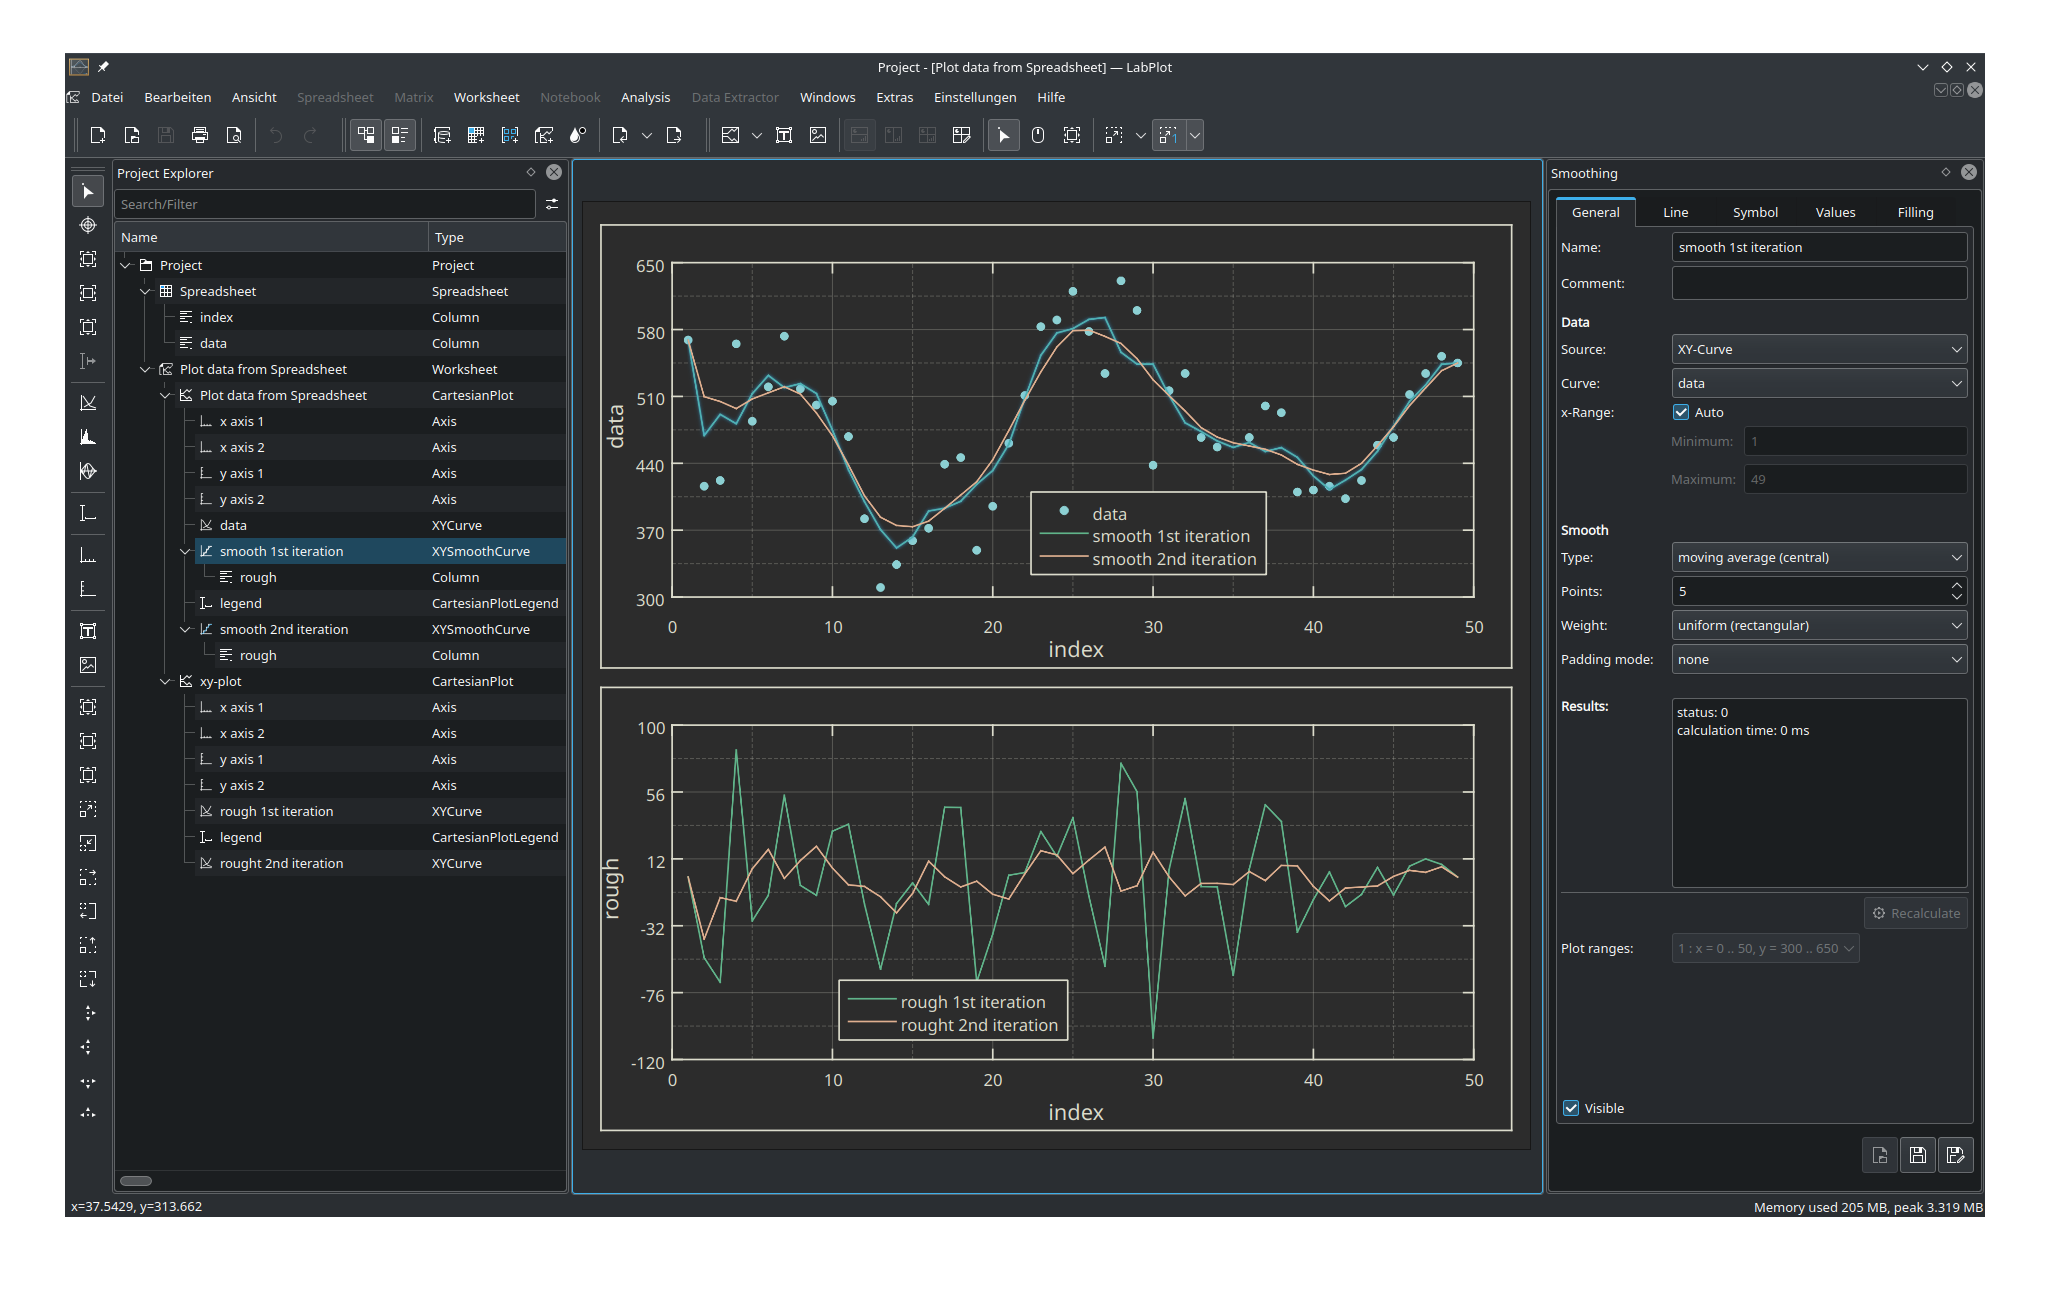
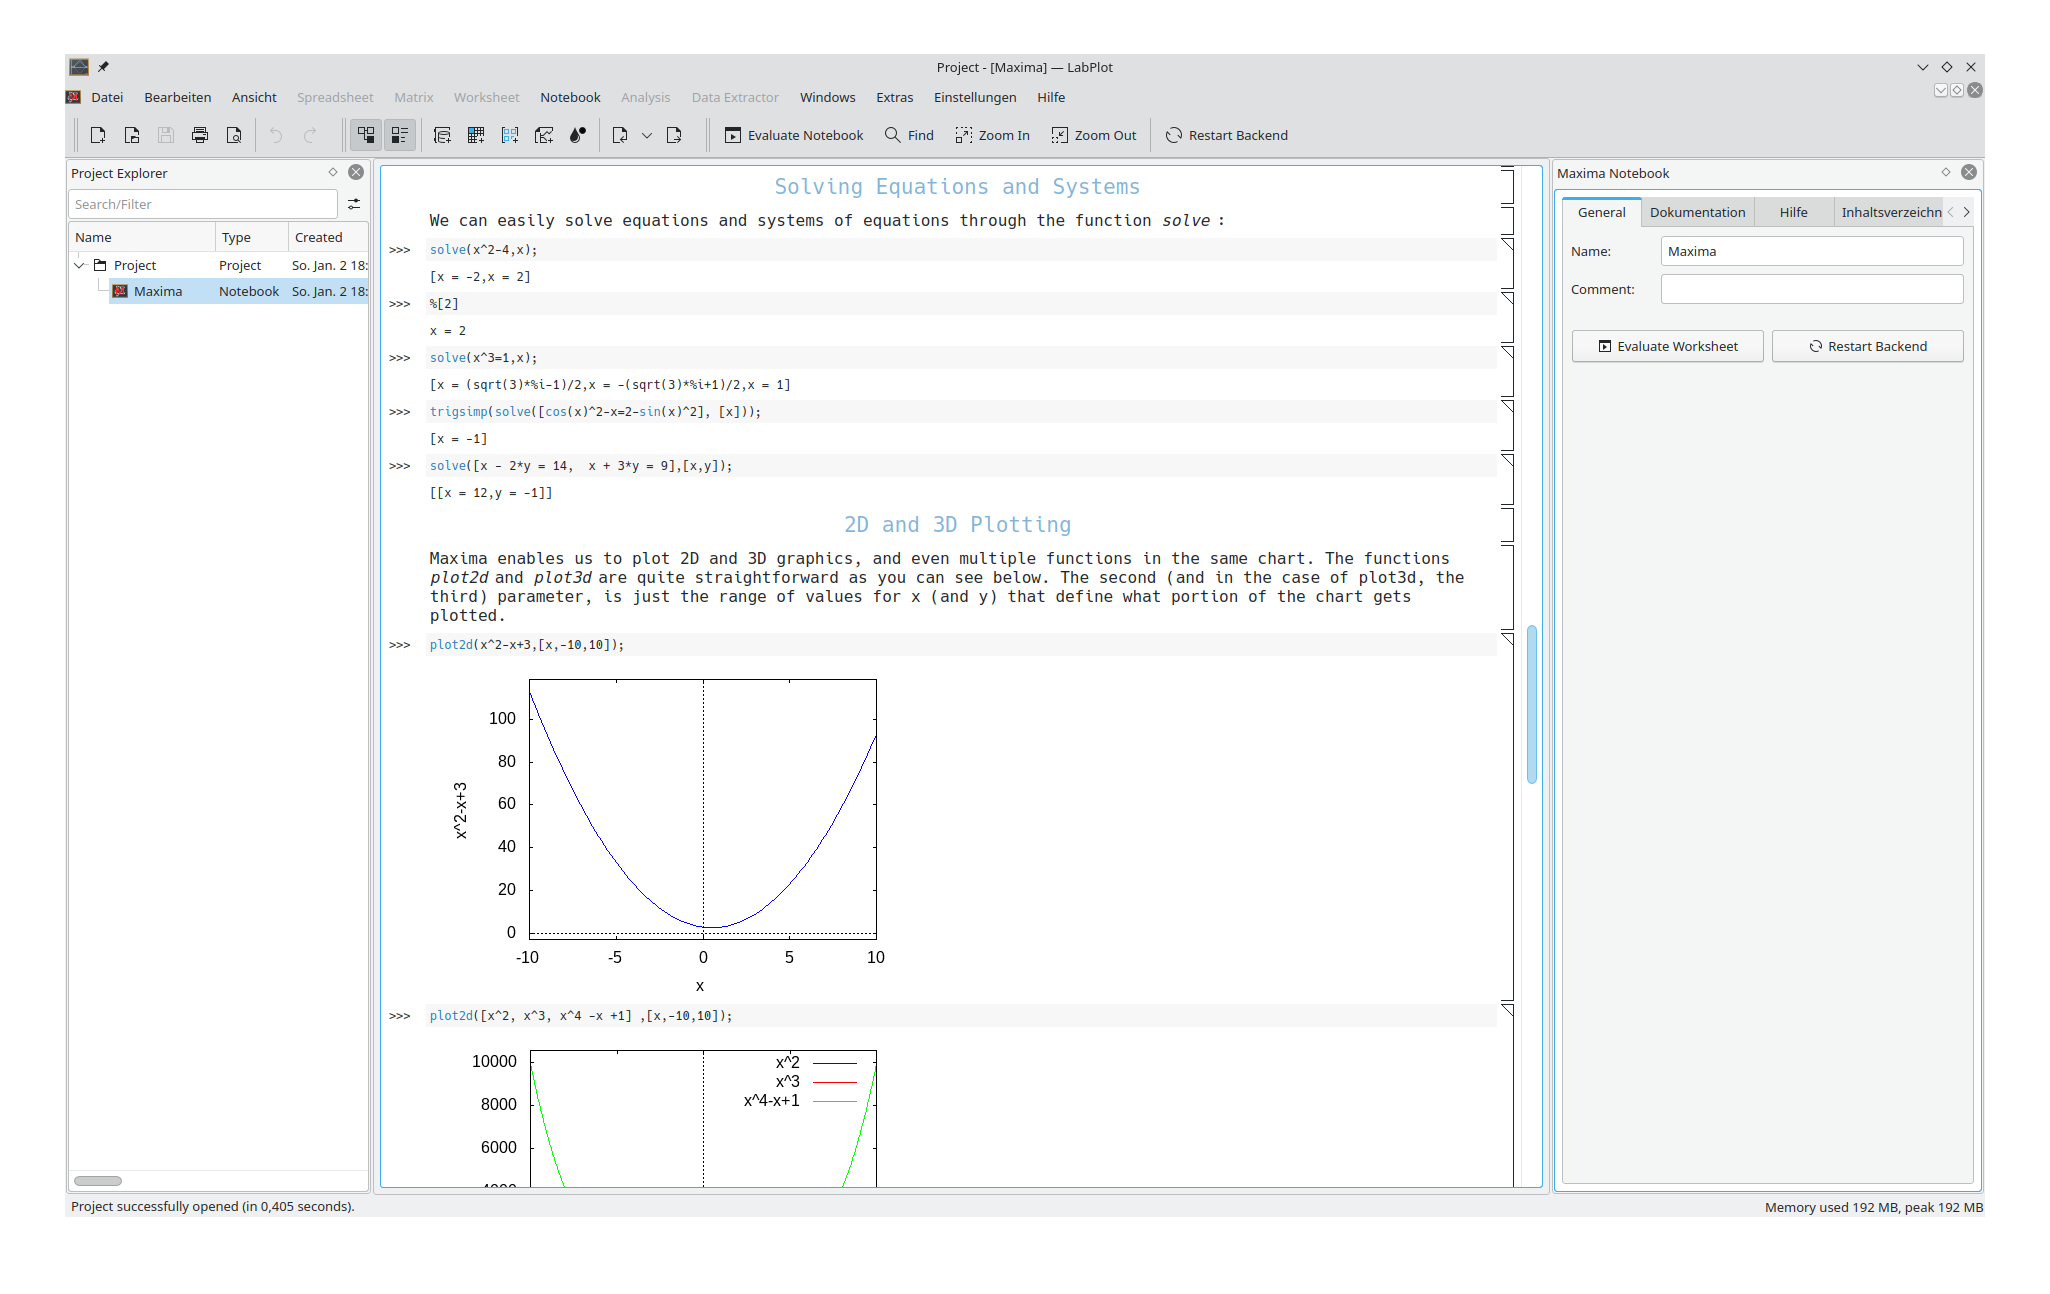
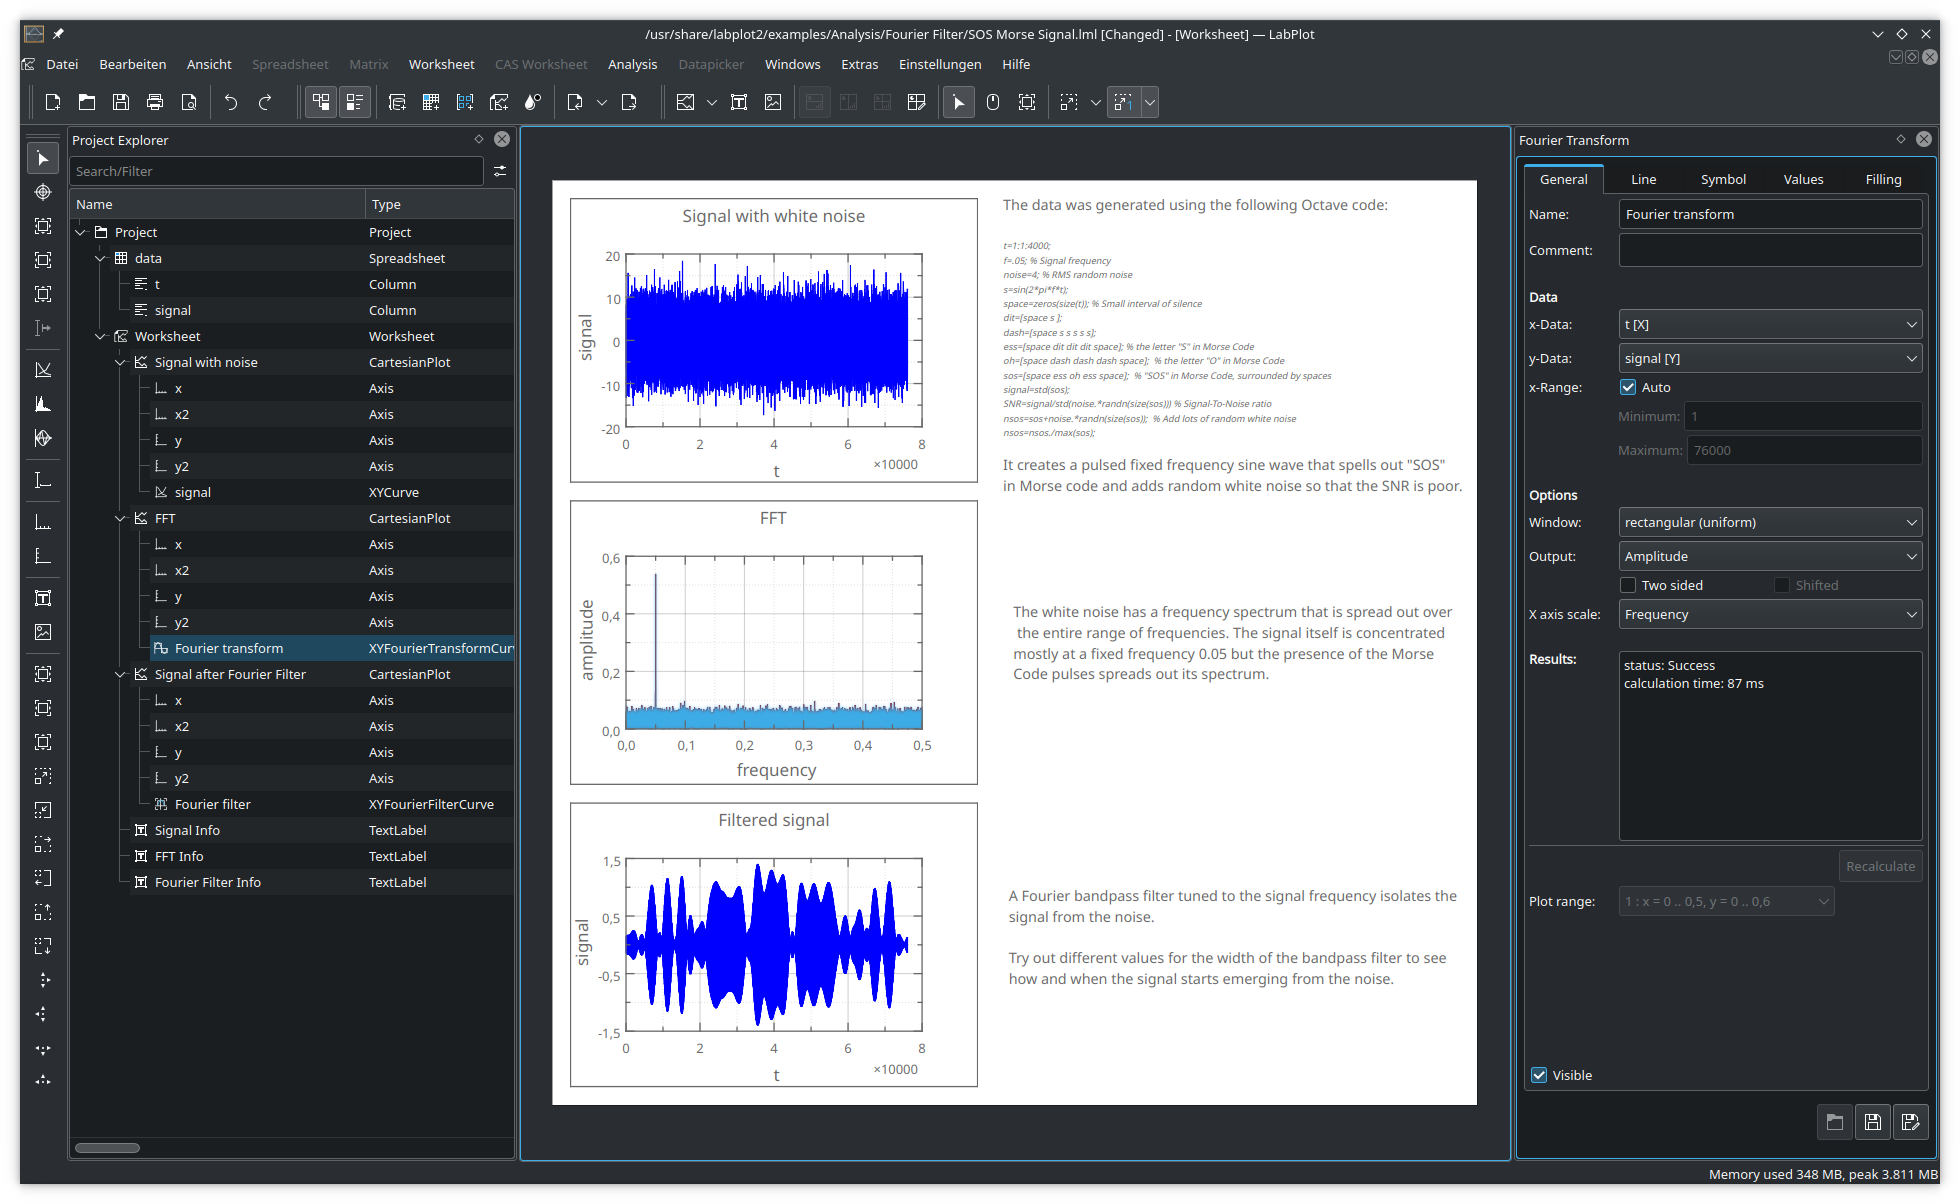
LabPlot is a FREE, open source and cross-platform Data Visualization and Analysis software accessible to everyone.

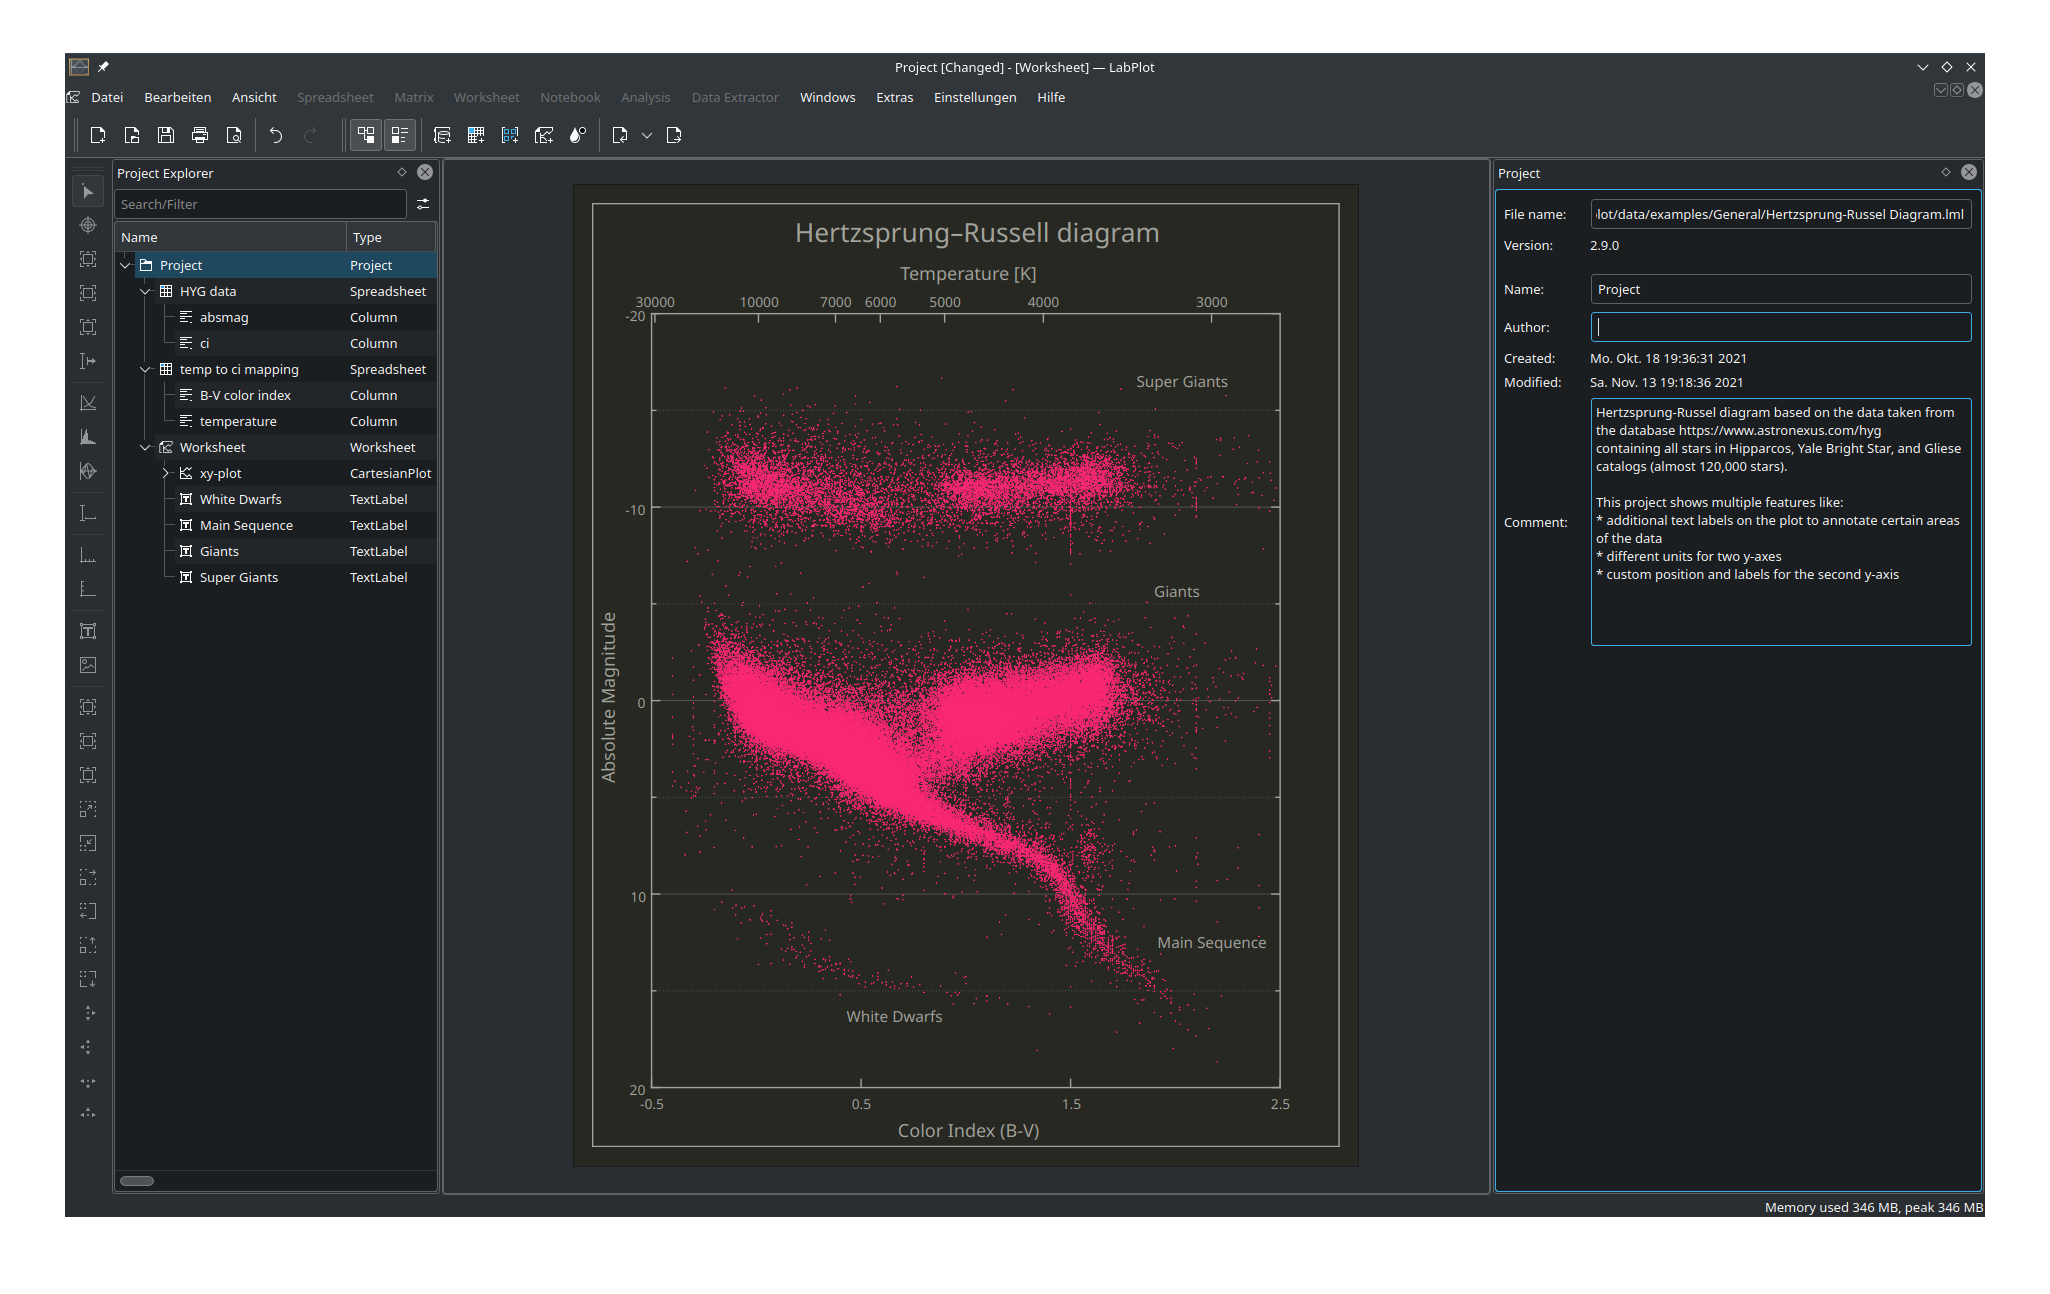
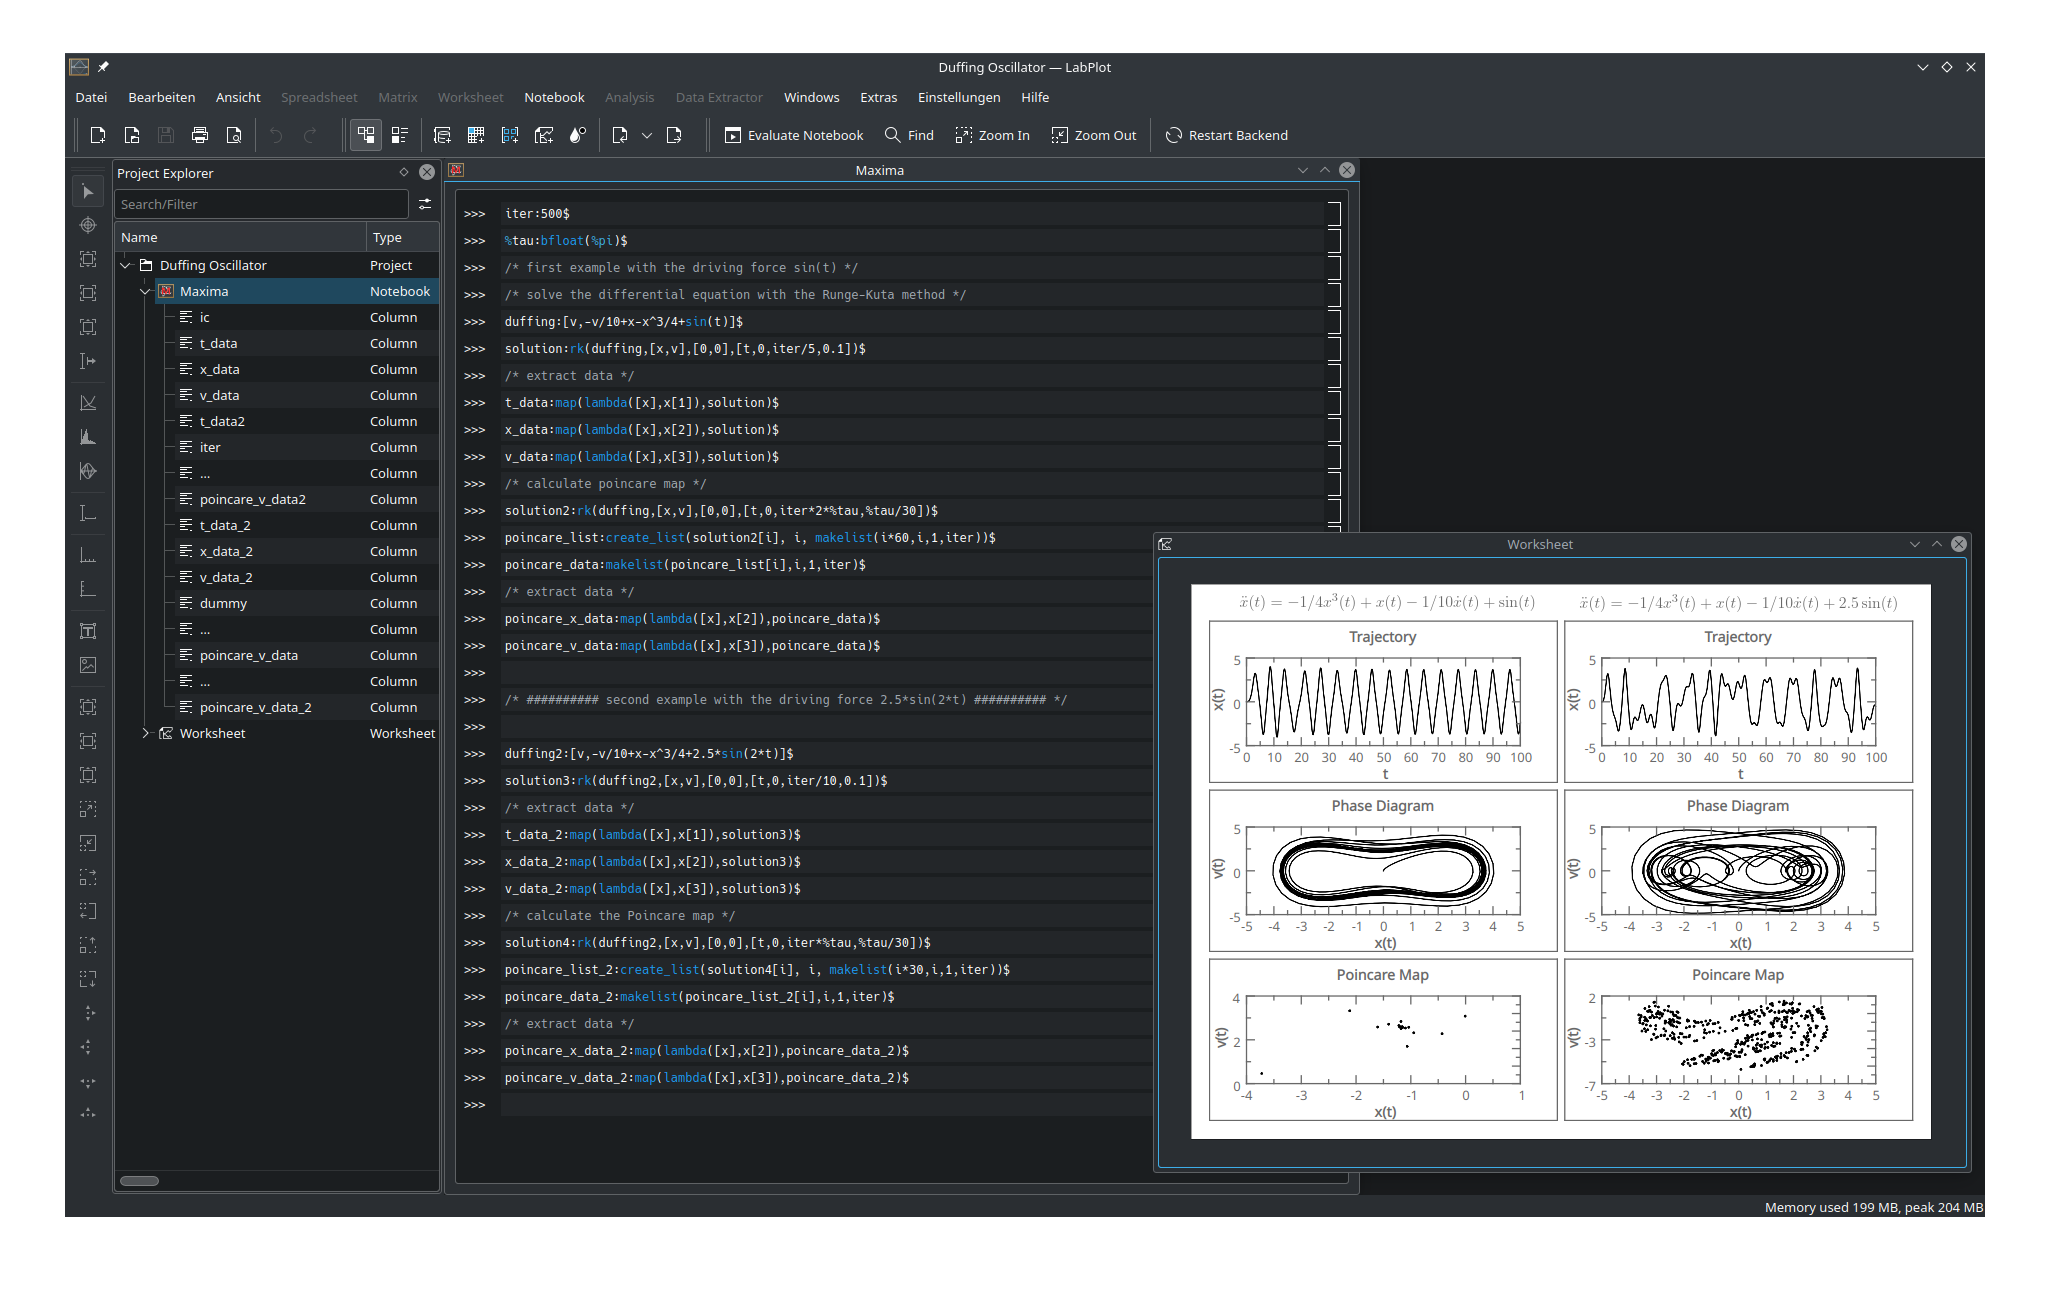
LabPlot provides an easy way to create, manage and edit plots. It allows you to produce plots based on data from a spreadsheet or on data imported from external files. Plots can be exported to several pixmap and vector graphic formats.

Installer på
Linux
Denne knappen verkar berre med Discover og andre AppStream-baserte appbutikkar. Du kan òg bruka pakke­handsamaren i distribusjonen din.
Installer via Snap Store
Installer via Microsoft Store

Versjonar RSS

2.10.1 2023-07-11
2.10.0 2023-03-21
2.9.0 2022-05-03
2.8.2 2021-04-01
2.8.1 2020-11-13
2.8.0 2020-09-16