KCachegrind
Категории: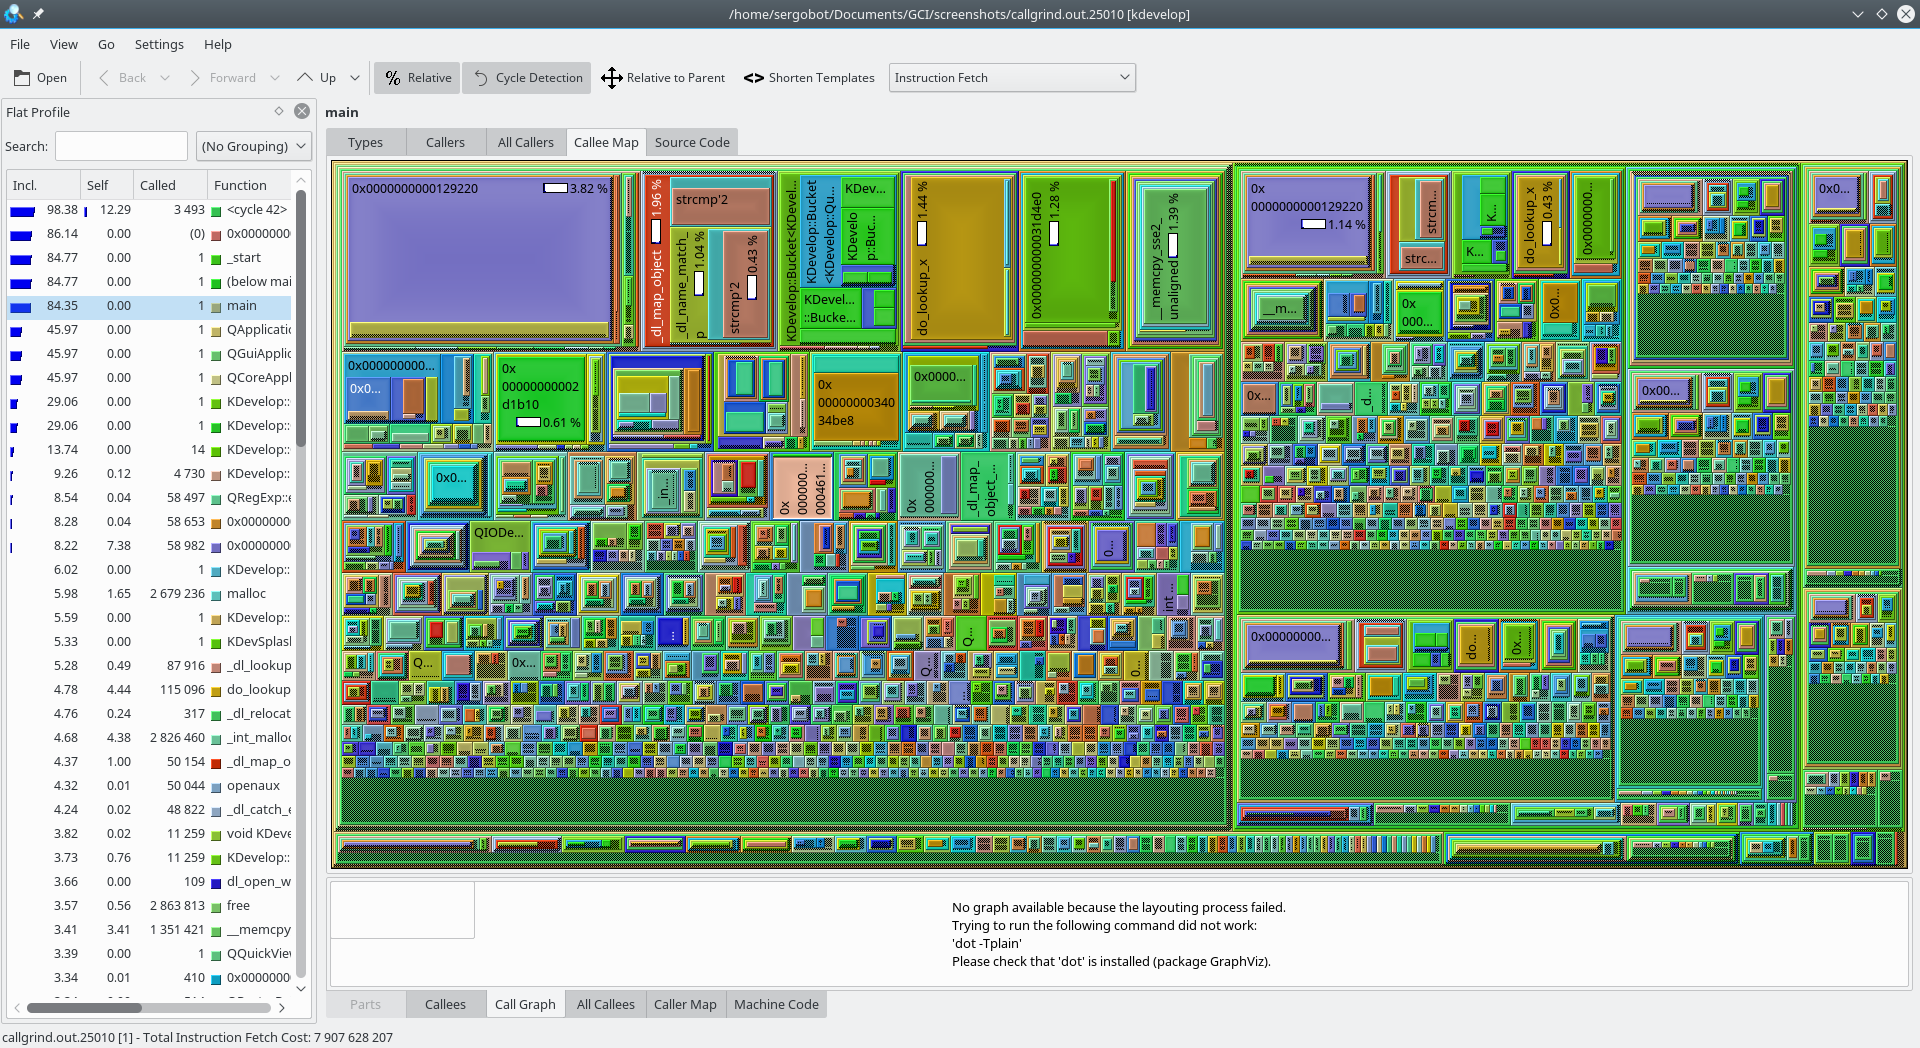
KCachegrind — это средство визуализации данных профилирования, используемое для определения наиболее трудоёмких частей при выполнении программы.
Возможности:
- Визуализация профилей (параметров выполнения) приложений различными способами, включая визуализацию графа вызовов и аннотацию исходного кода и кода дизассемблера.
- Загрузка профилей, созданных программой симуляции кэша/трассировщиком вызовов Calltree (инструментом Valgrind). Таким образом, профилирование не нуждается в какой-либо подготовке, допускает работу с общими библиотеками и архитектурами модулей и не влияет на сам процесс измерения.
- Сценарии преобразователя для OProfile, Perl и PHP.
- Переключение между несколькими форматами визуализации.
- Экспорт графа вызовов как изображения в формате PNG.
- Одновременное отображение двух типов событий на панелях вызовов и аннотаций.

Установить на
Linux


Выпуски RSS
25.12.2
2026-02-05
25.12.1
2026-01-08
25.12.0
2025-12-11
25.08.3
2025-11-06
25.08.2
2025-10-09
25.08.1
2025-09-11
25.08.0
2025-08-14
25.04.3
2025-07-03
25.04.2
2025-06-05
25.04.1
2025-05-08
25.04.0
2025-04-17
24.12.3
2025-03-06
24.12.2
2025-02-06
24.12.1
2025-01-09
24.12.0
2024-12-12
24.08.3
2024-11-07
24.08.2
2024-10-10
24.08.1
2024-09-12
24.08.0
2024-08-22
24.05.2
2024-07-04
24.05.1
2024-06-13
24.05.0
2024-05-23
24.02.2
2024-04-11
24.02.1
2024-03-21
24.02.0
2024-02-28
23.08.5
2024-02-15