LabPlot
Kategórie:
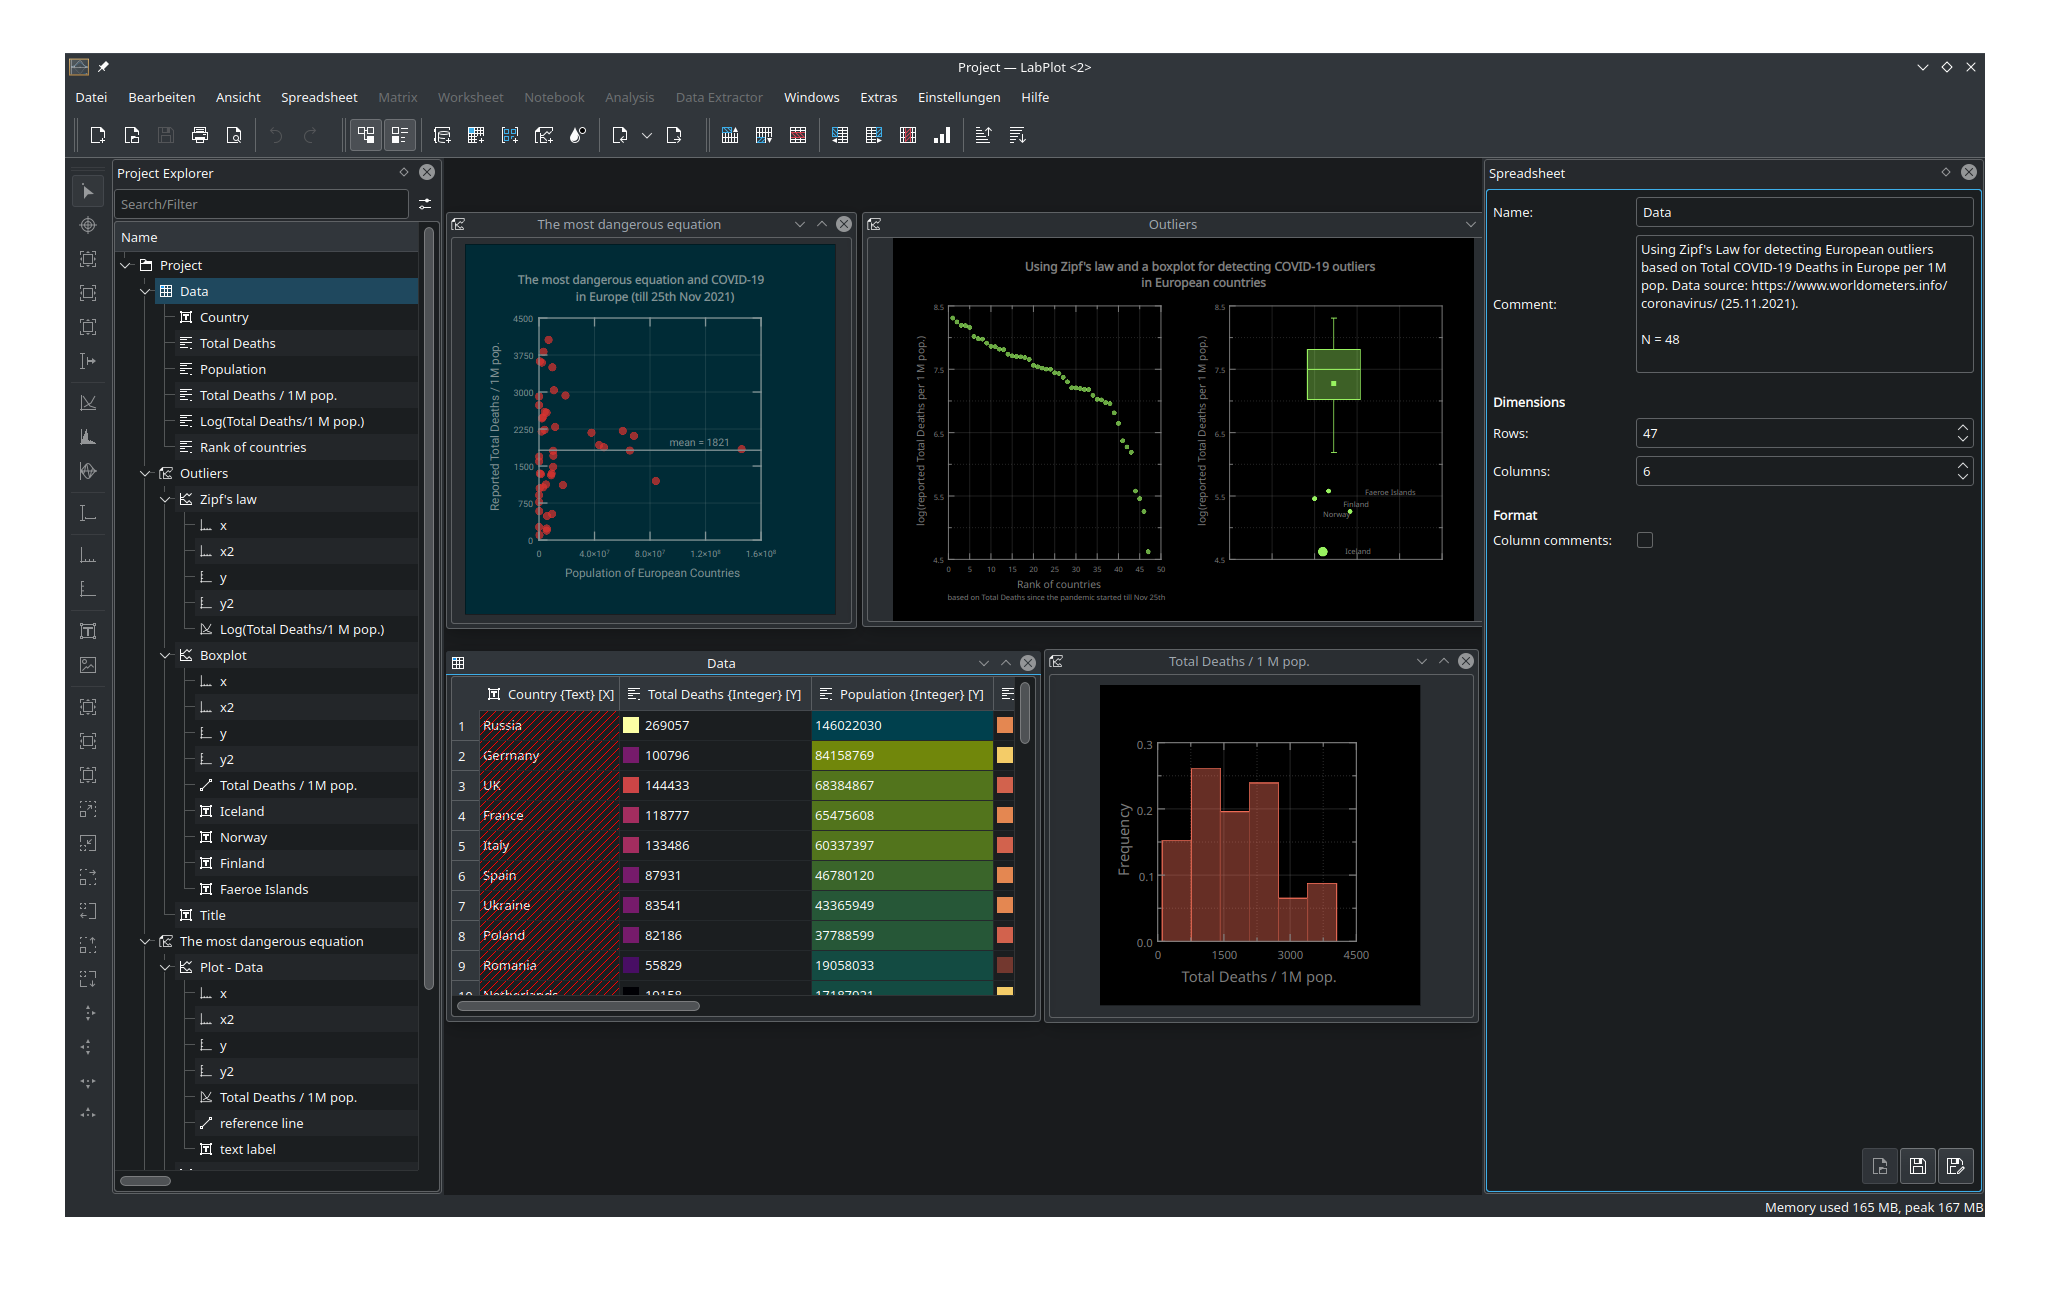
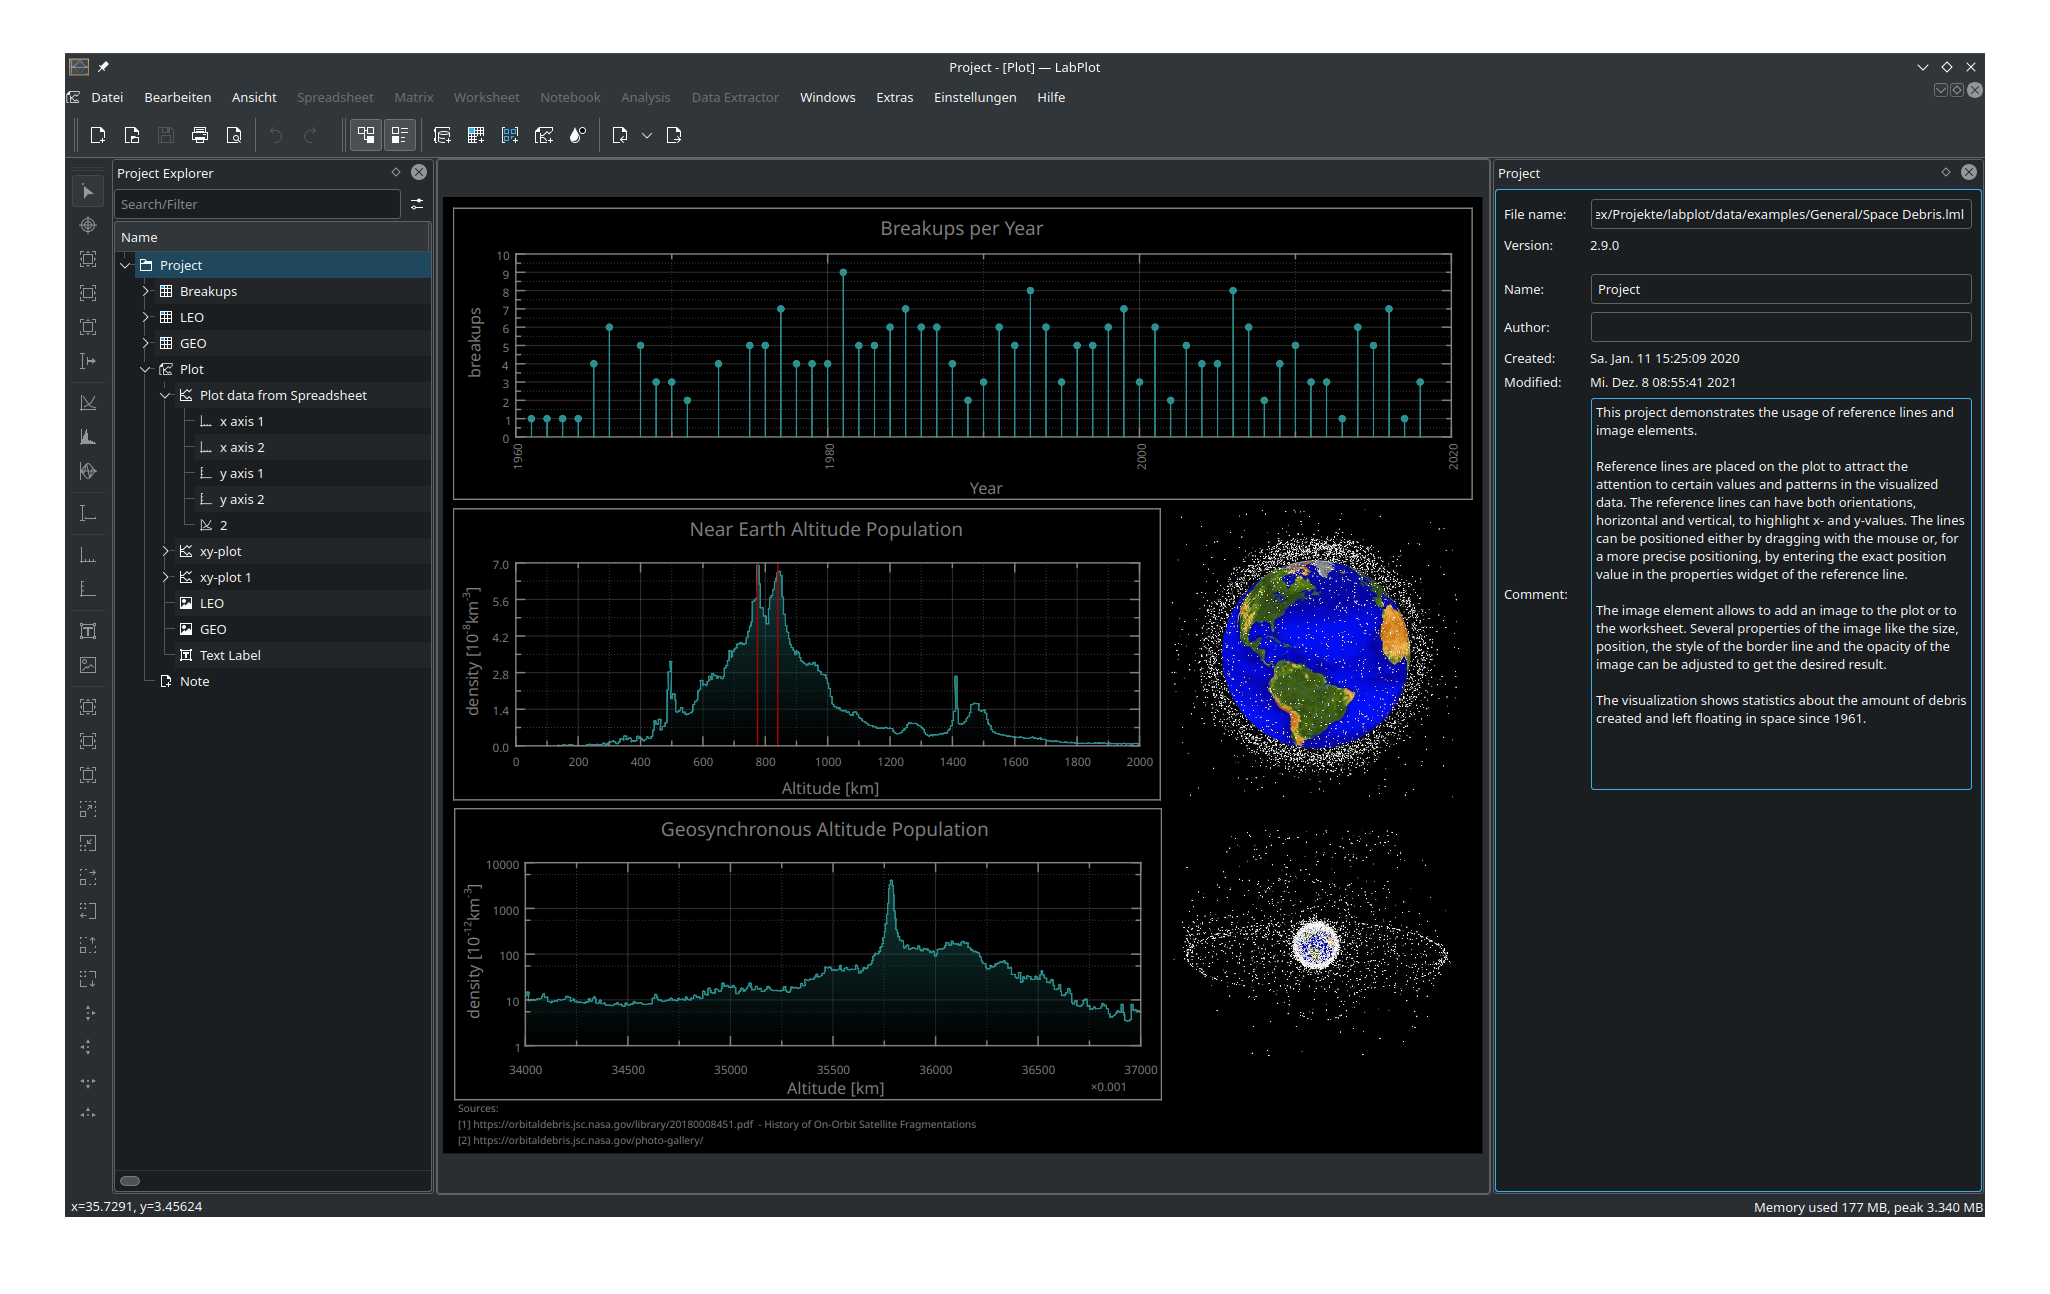
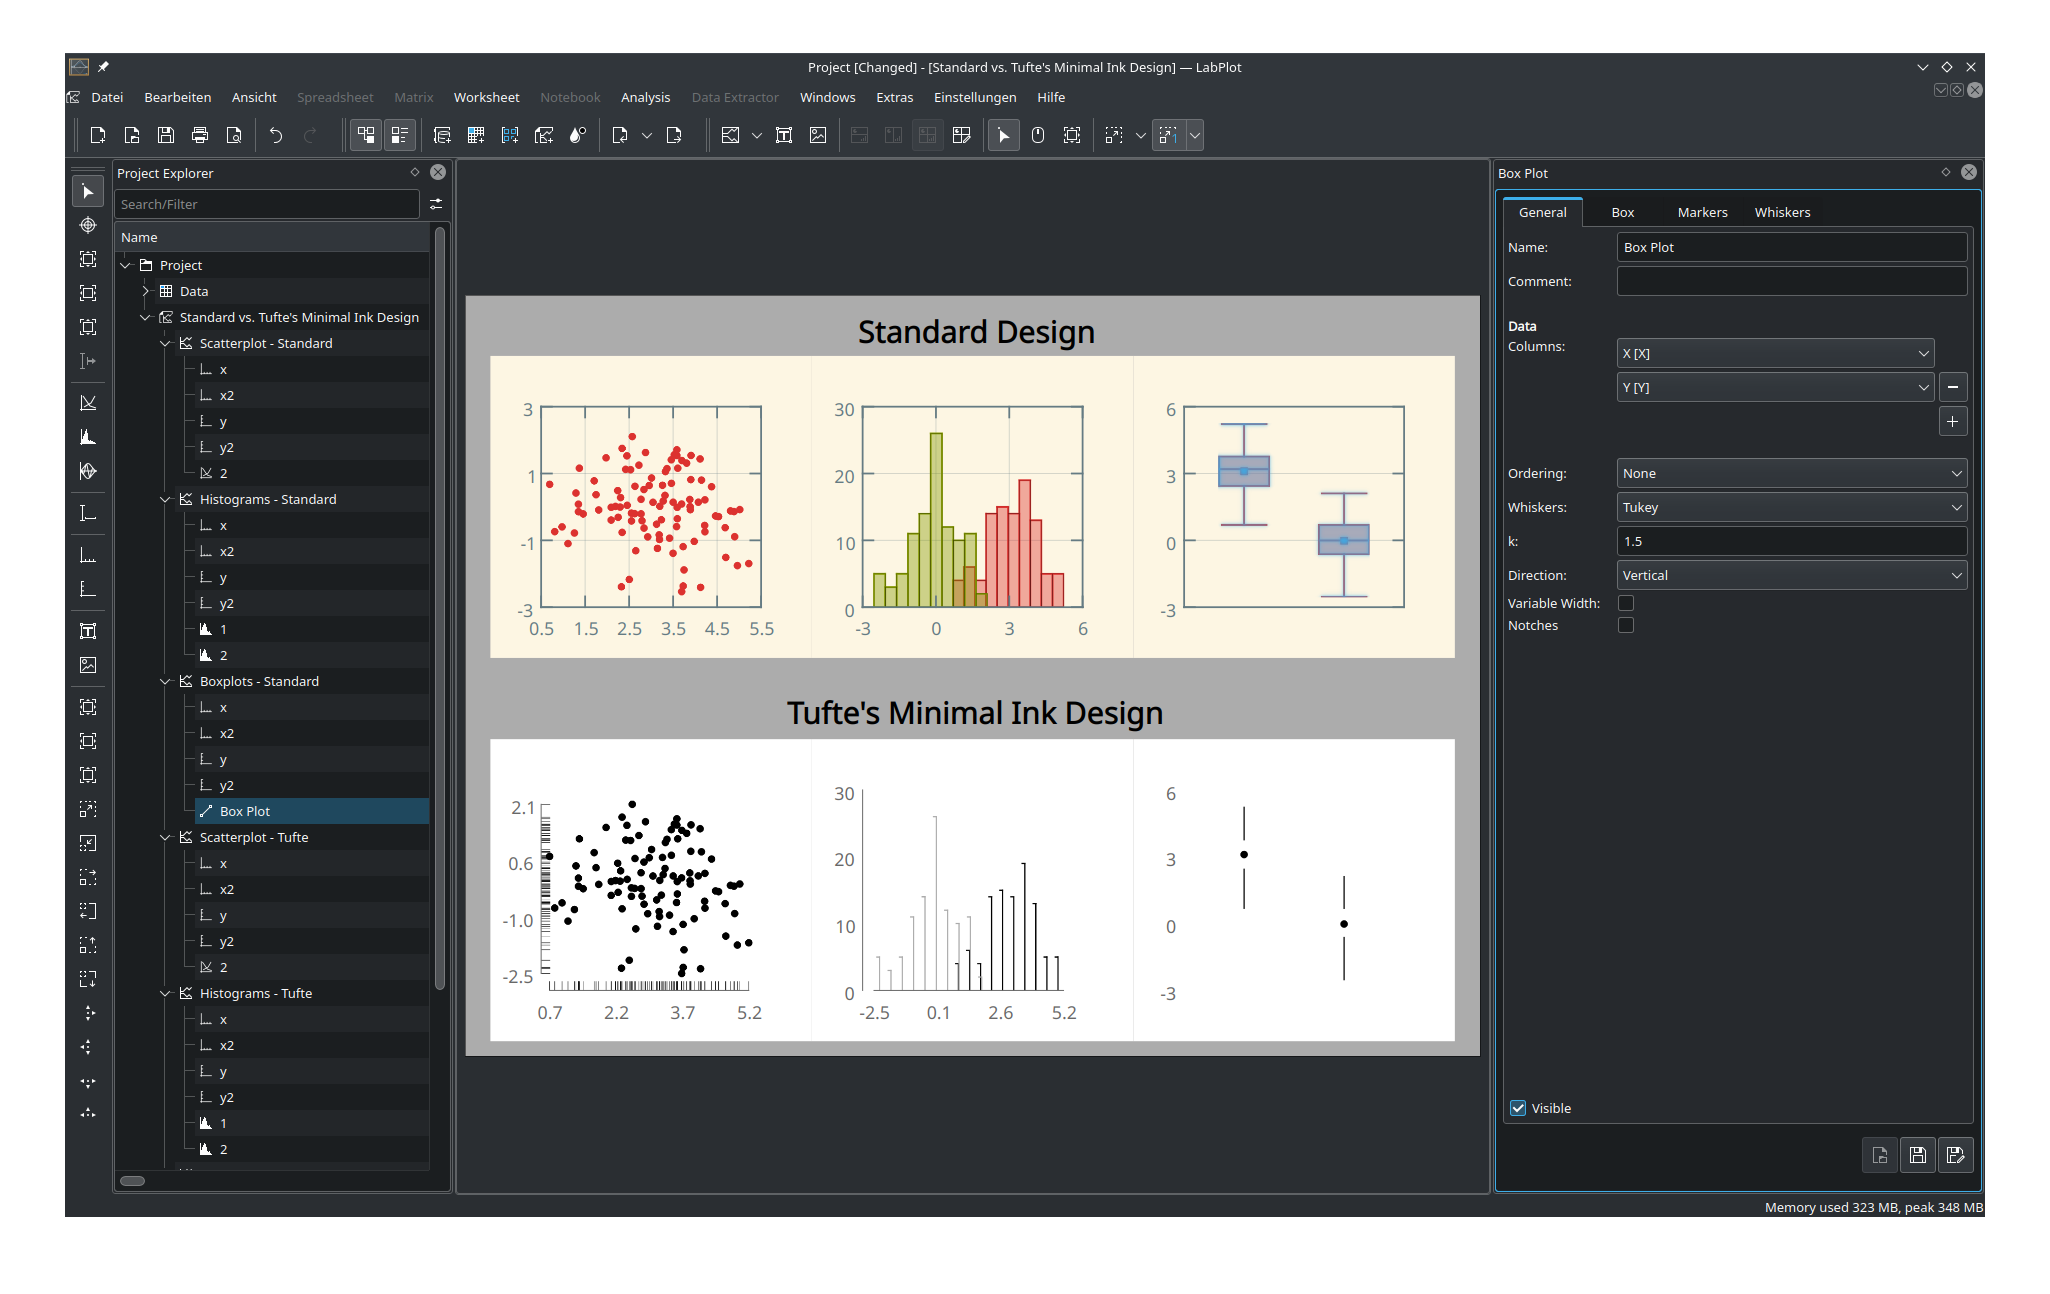
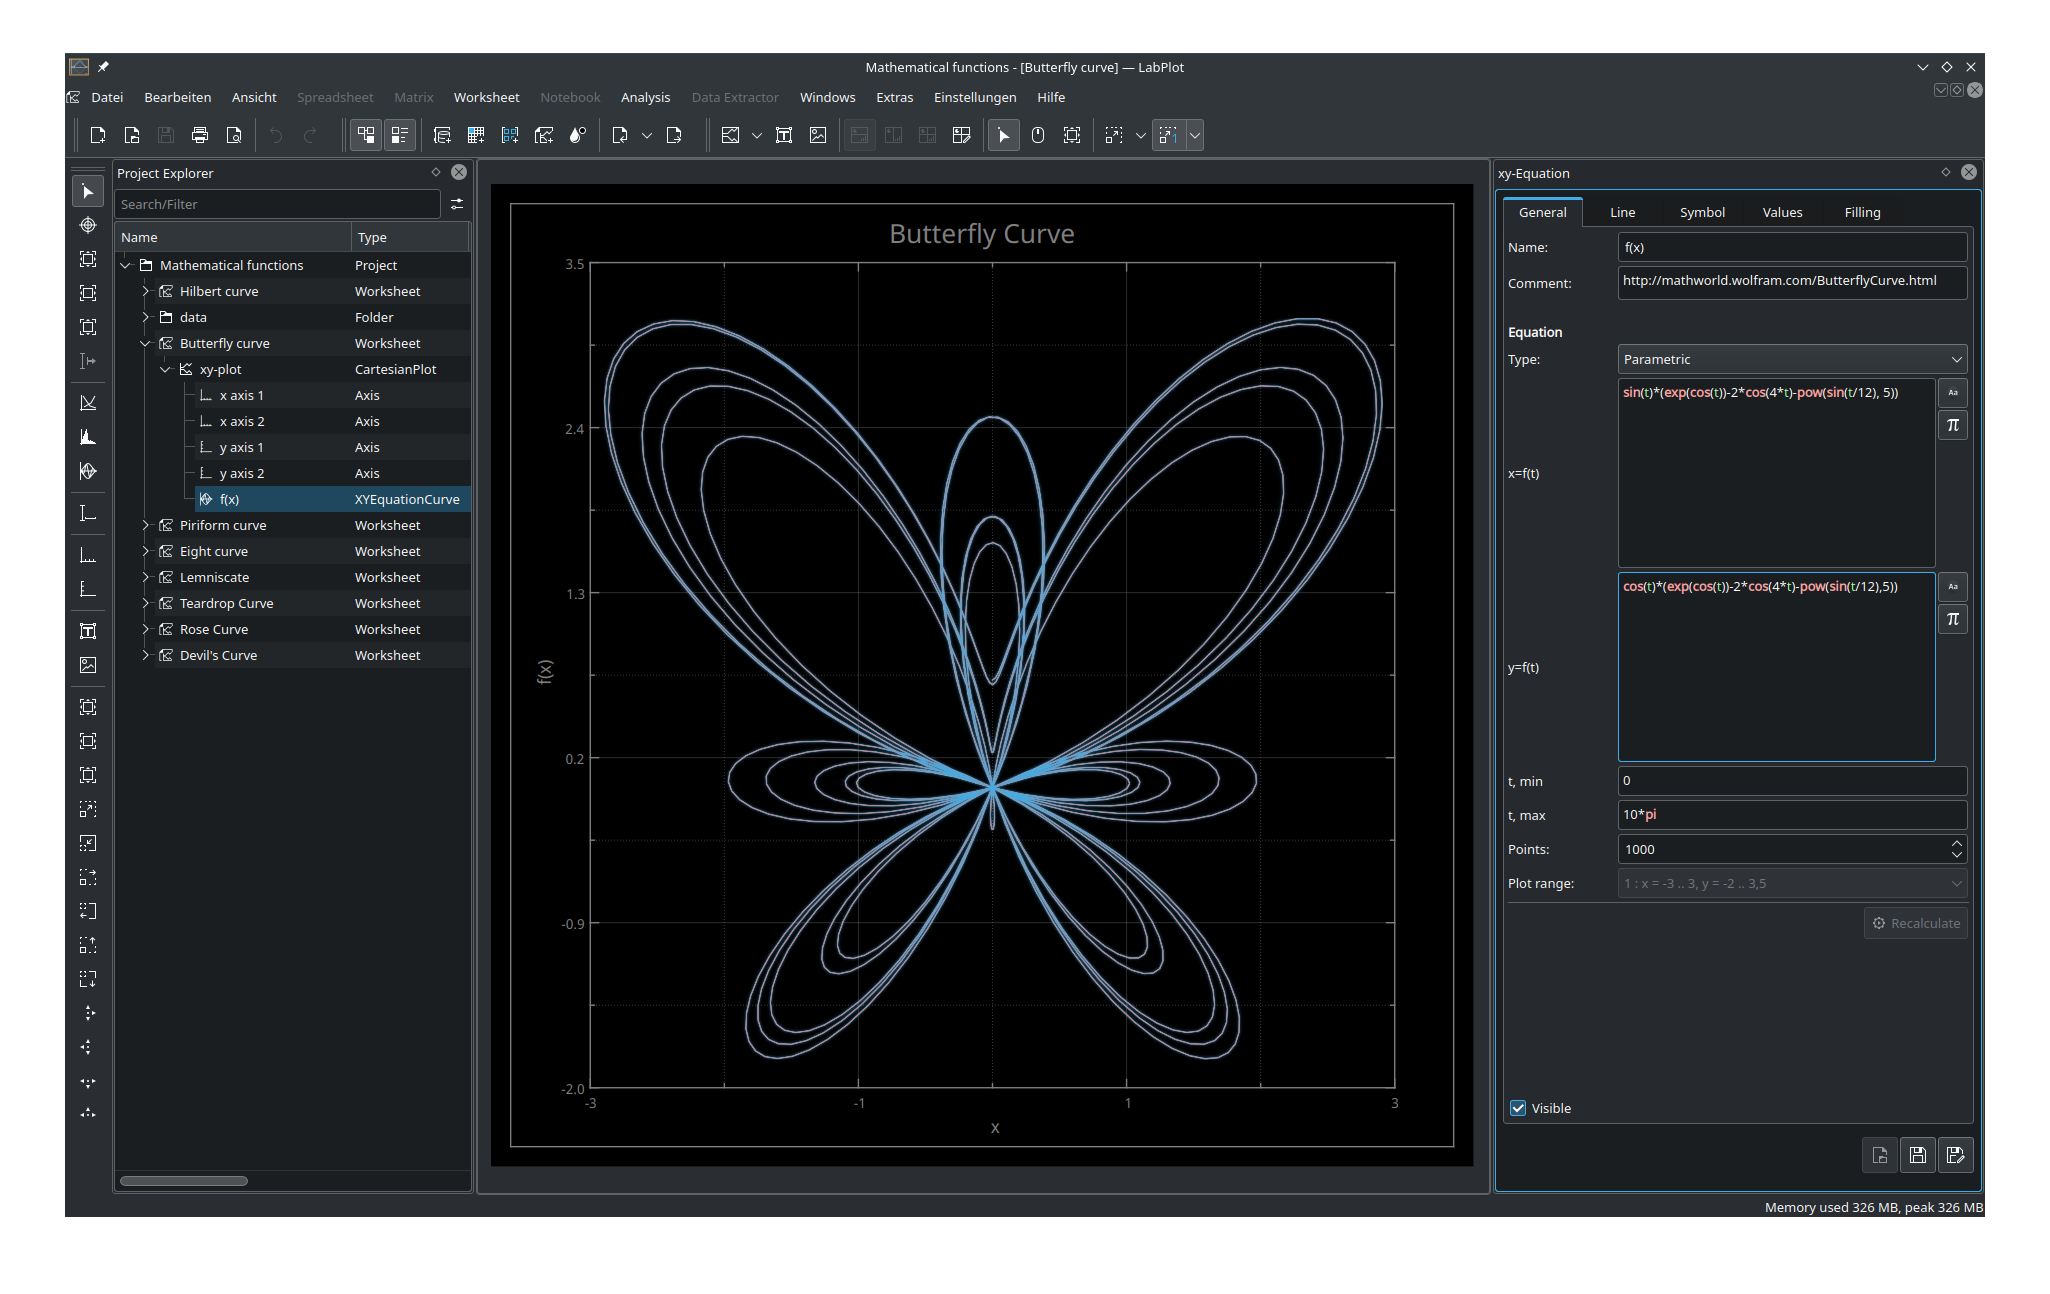
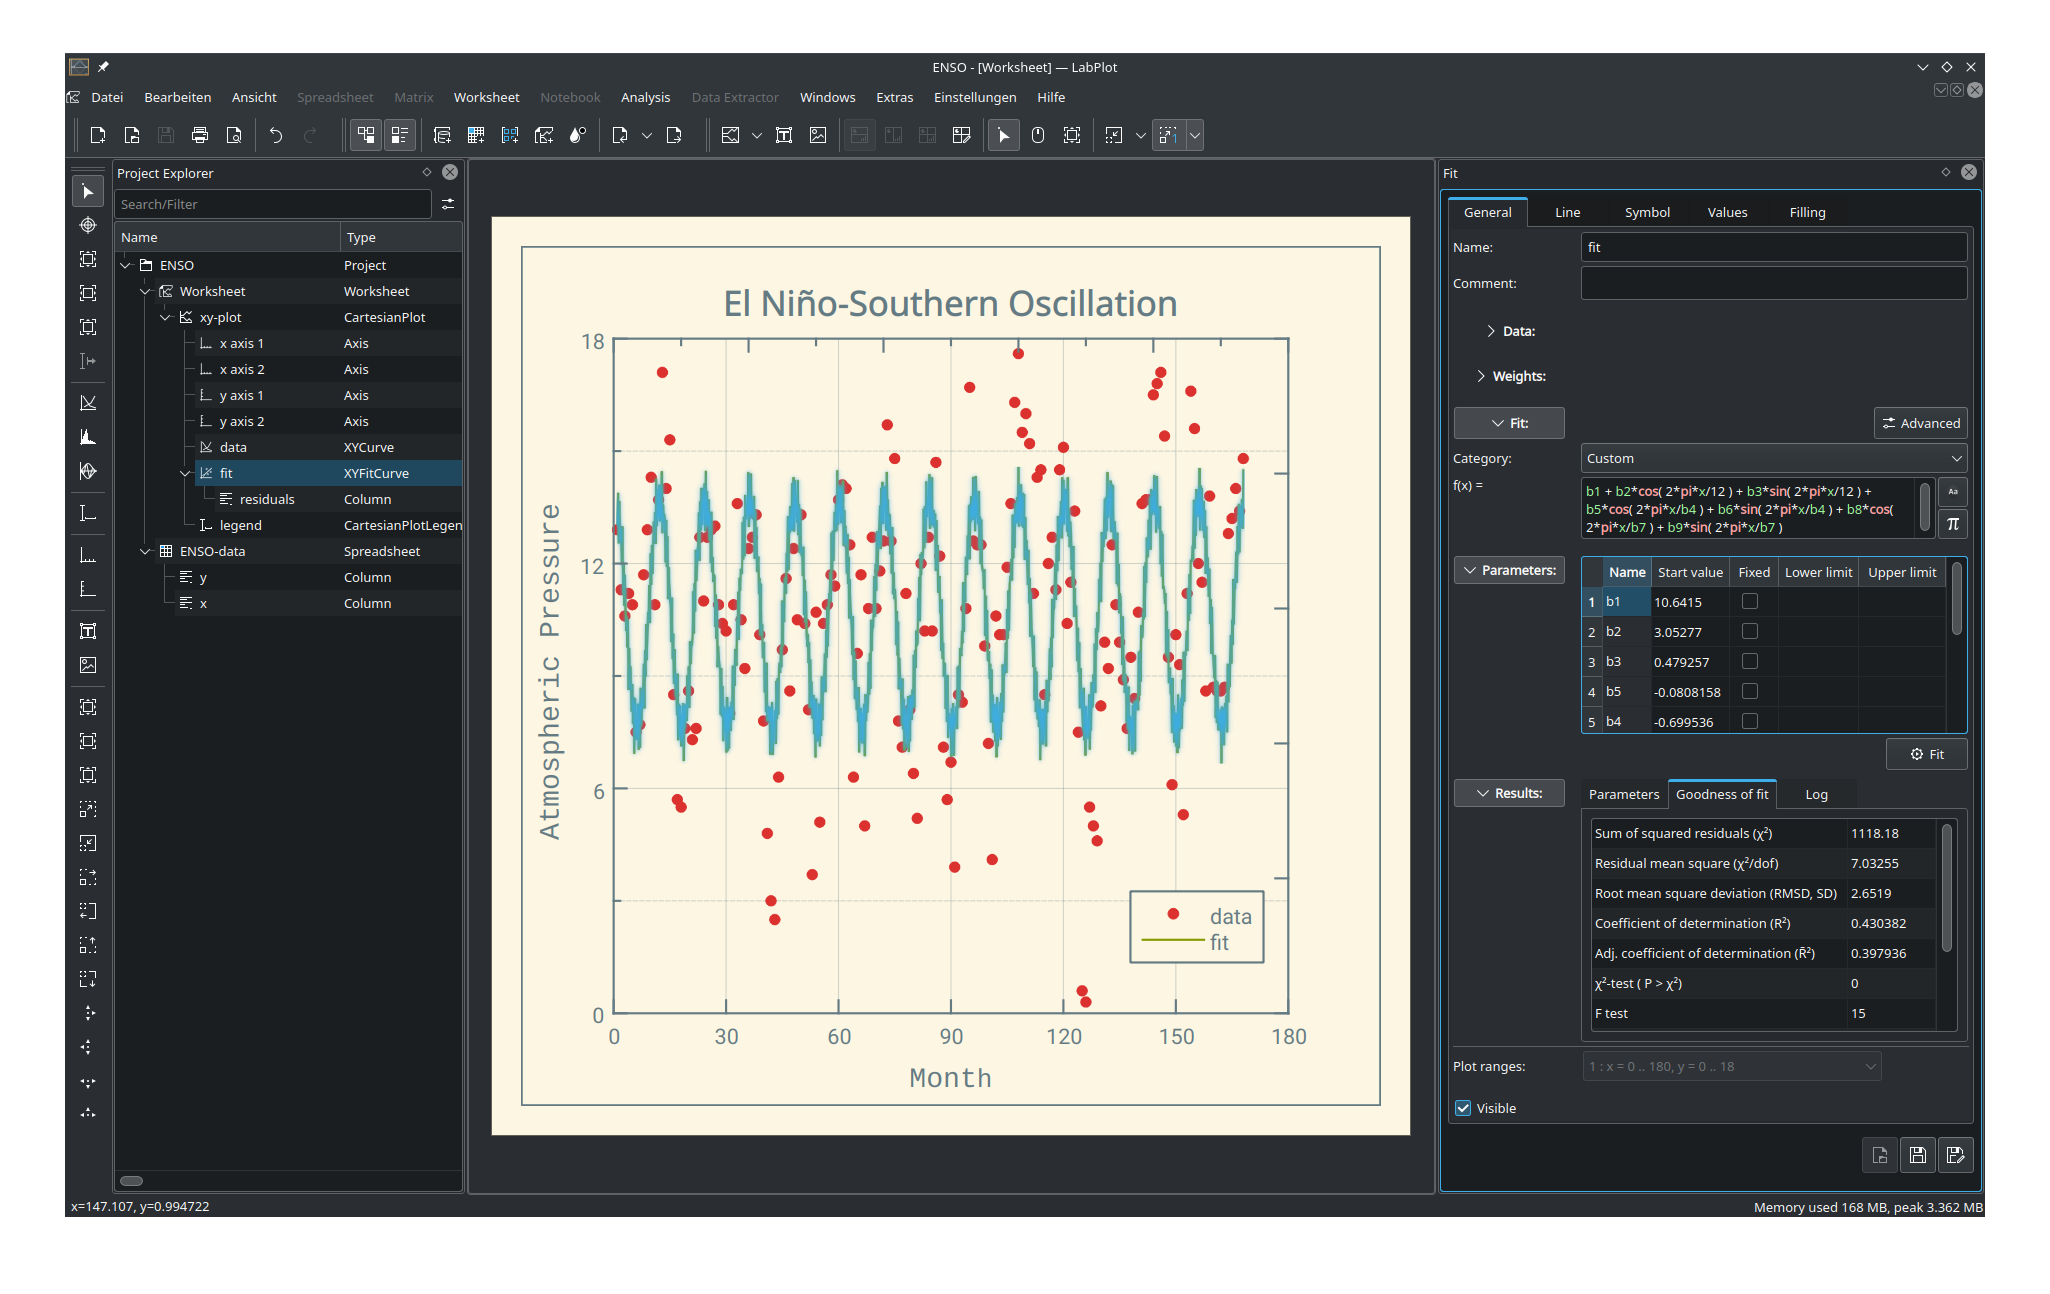
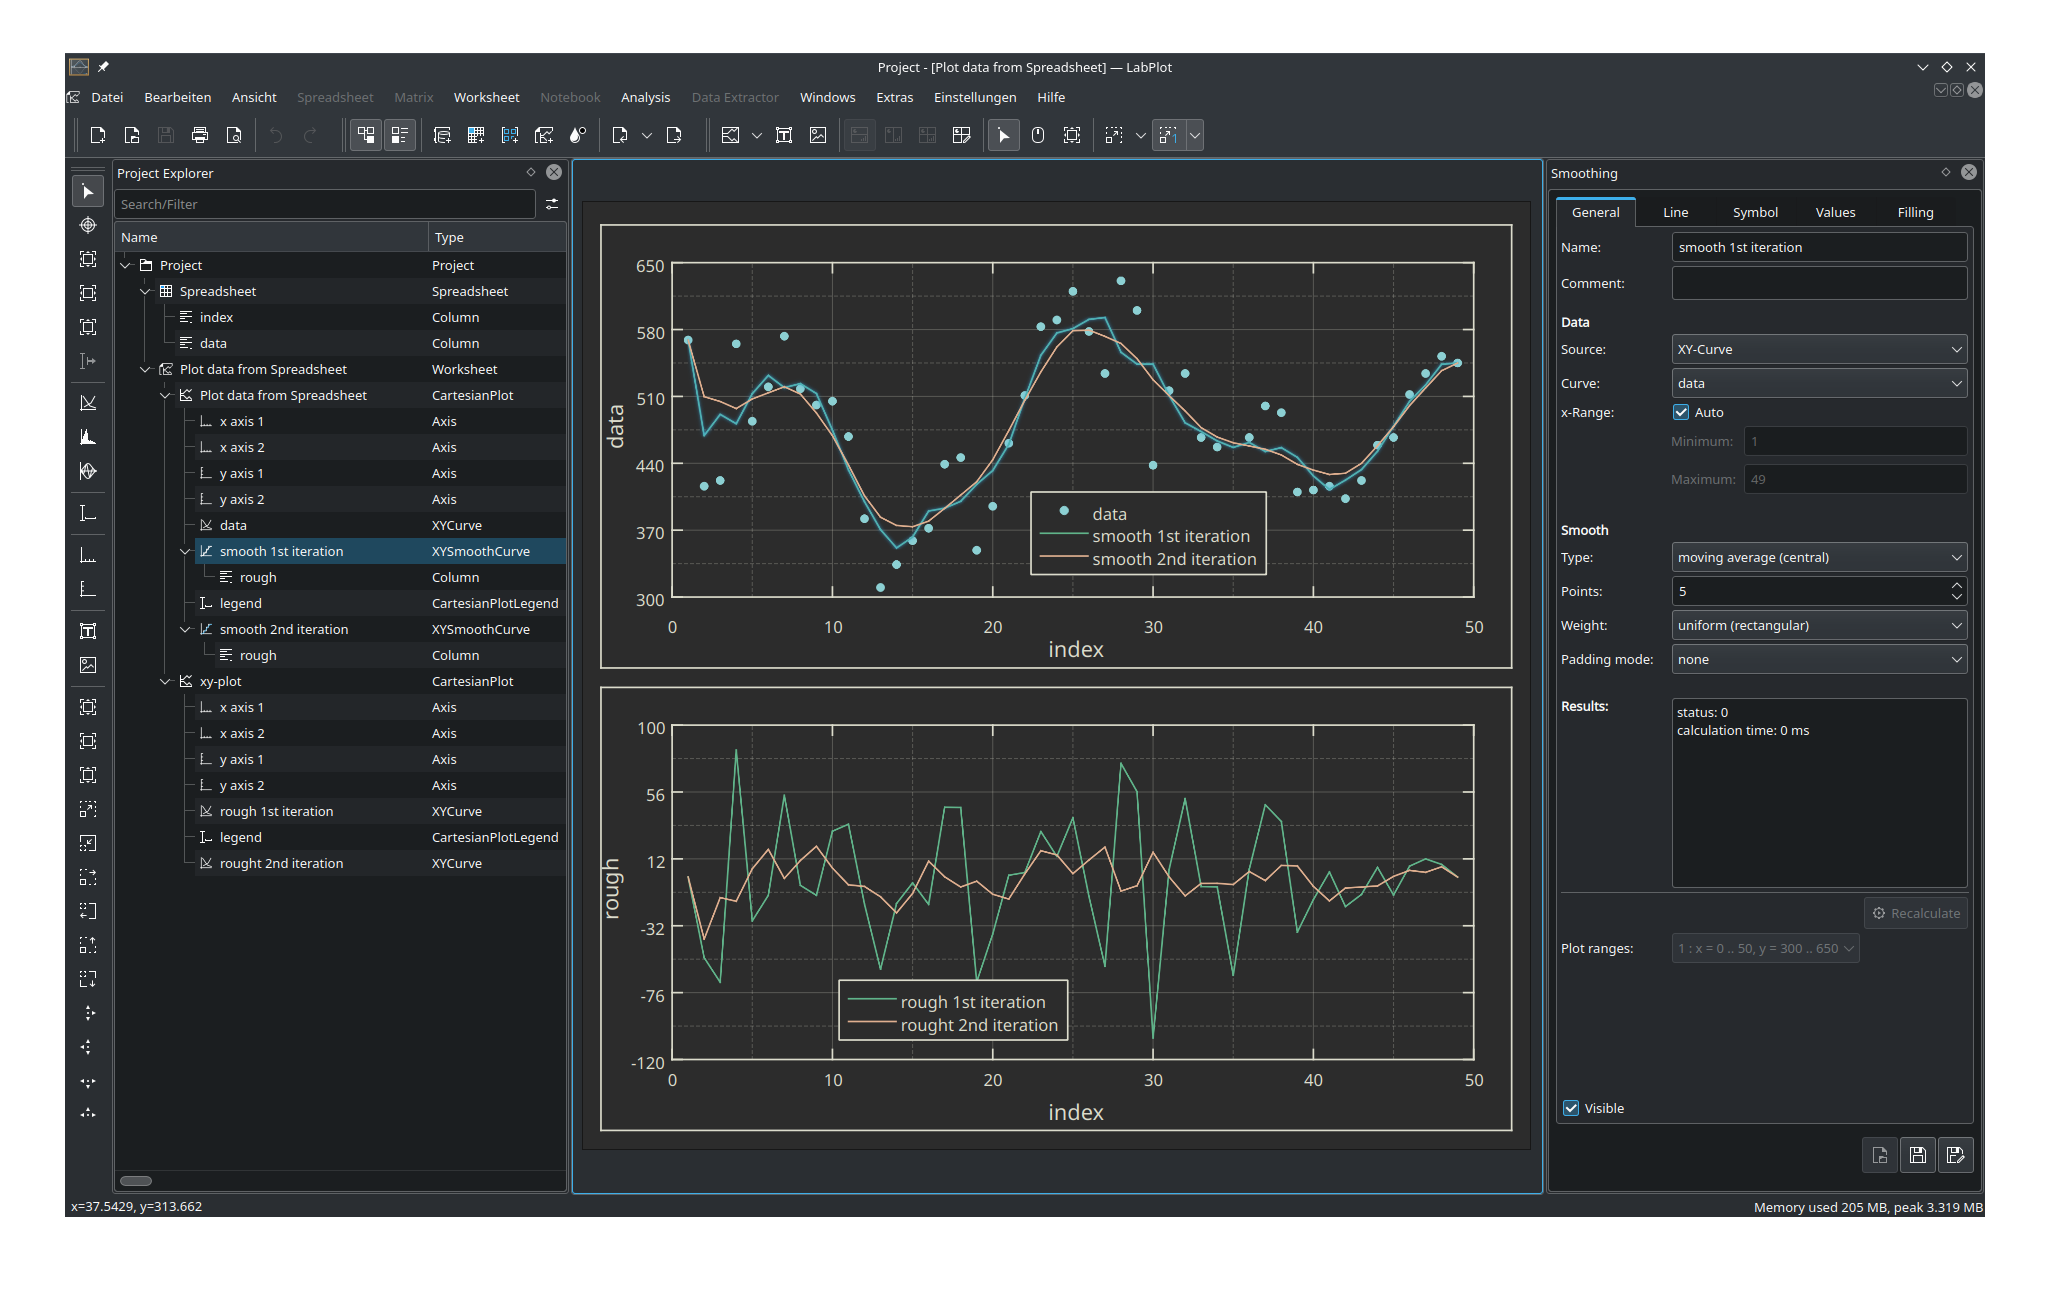
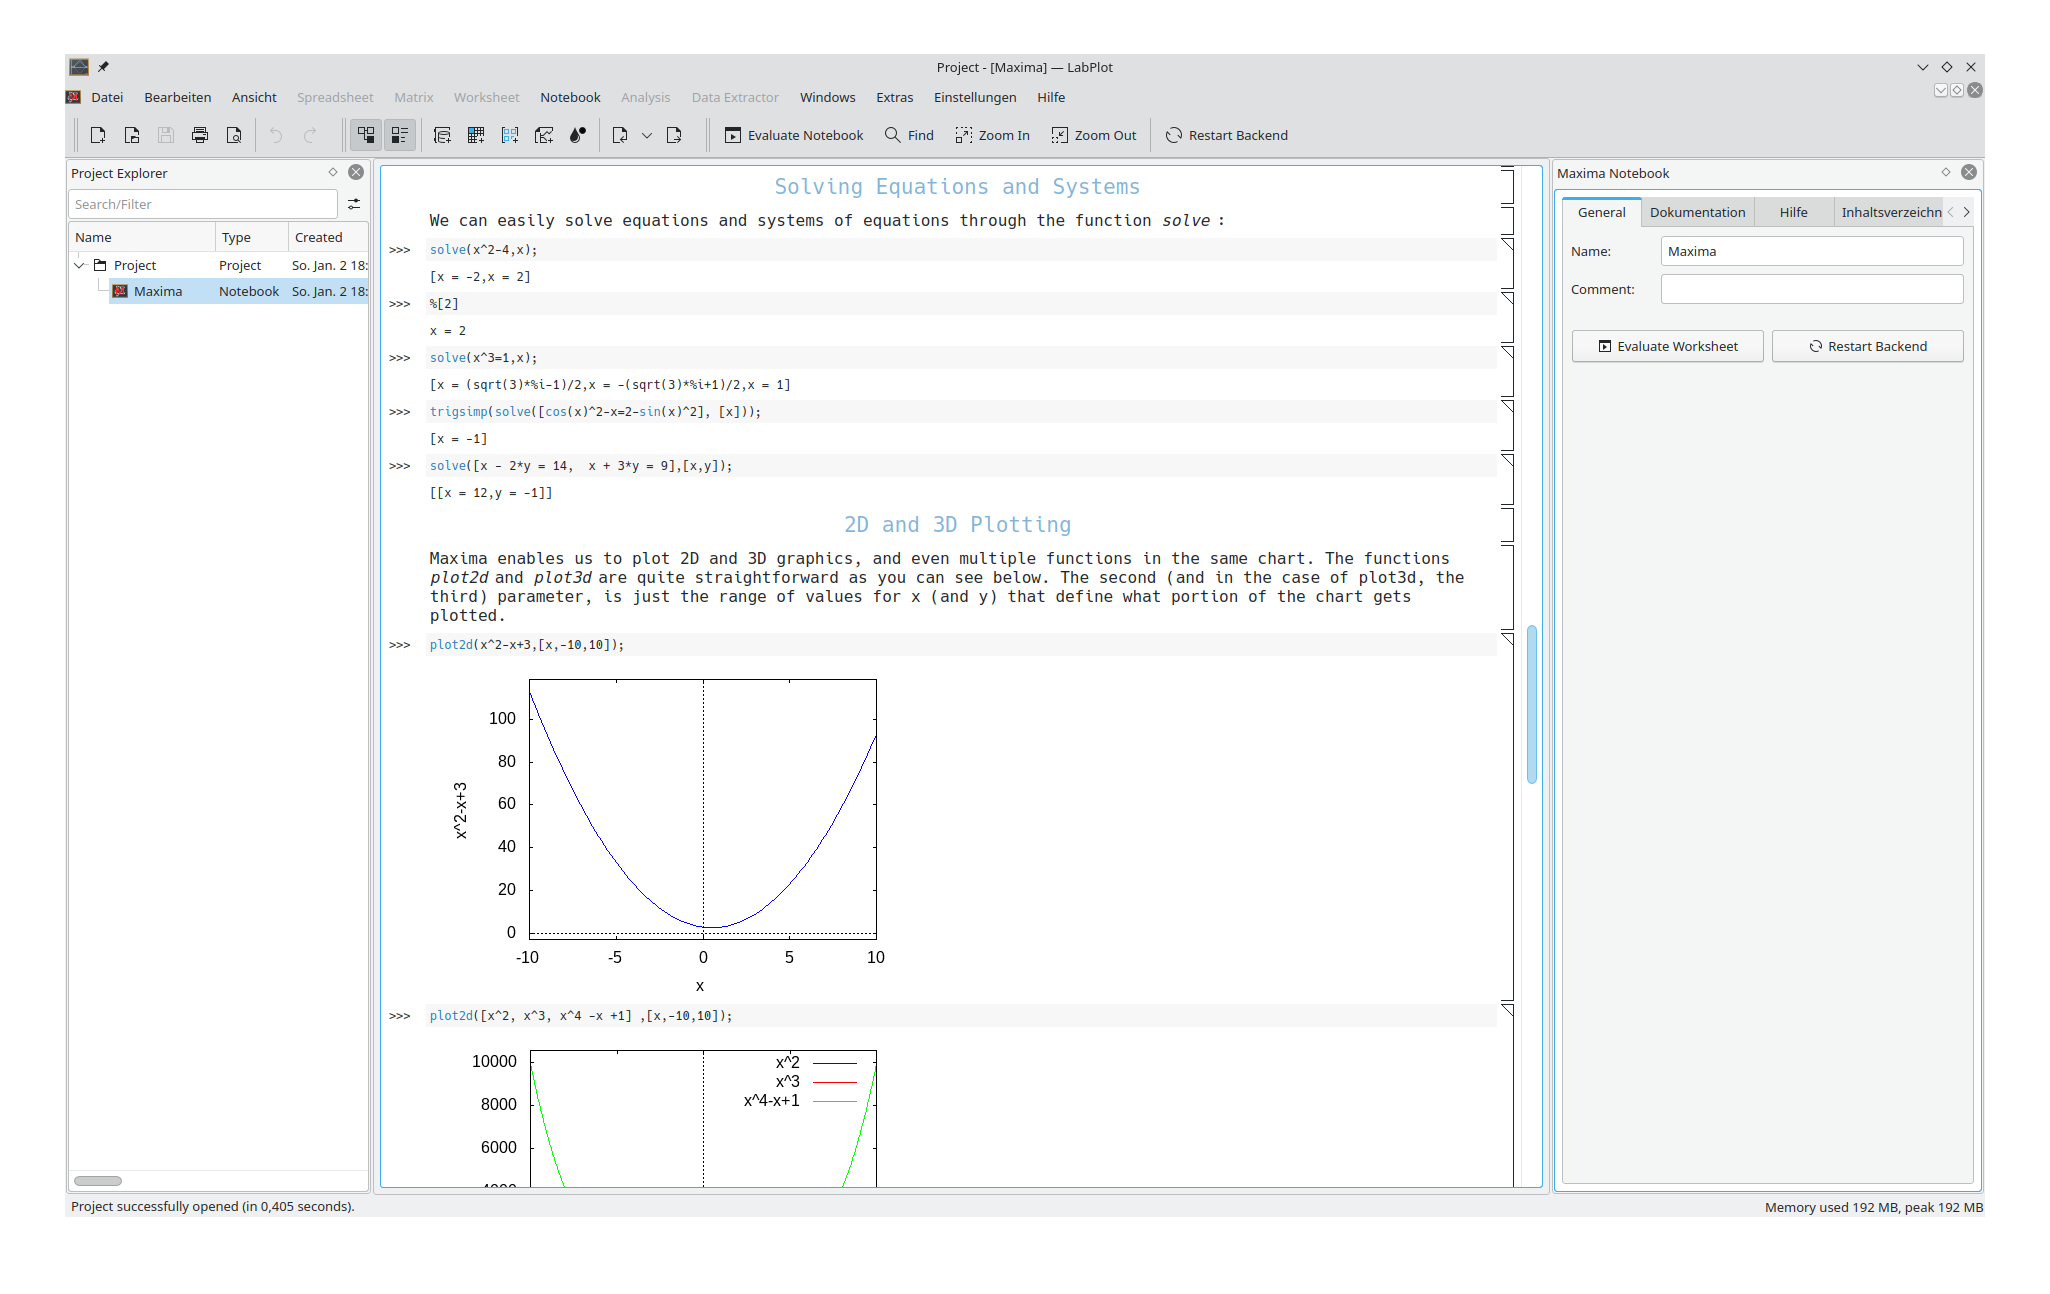
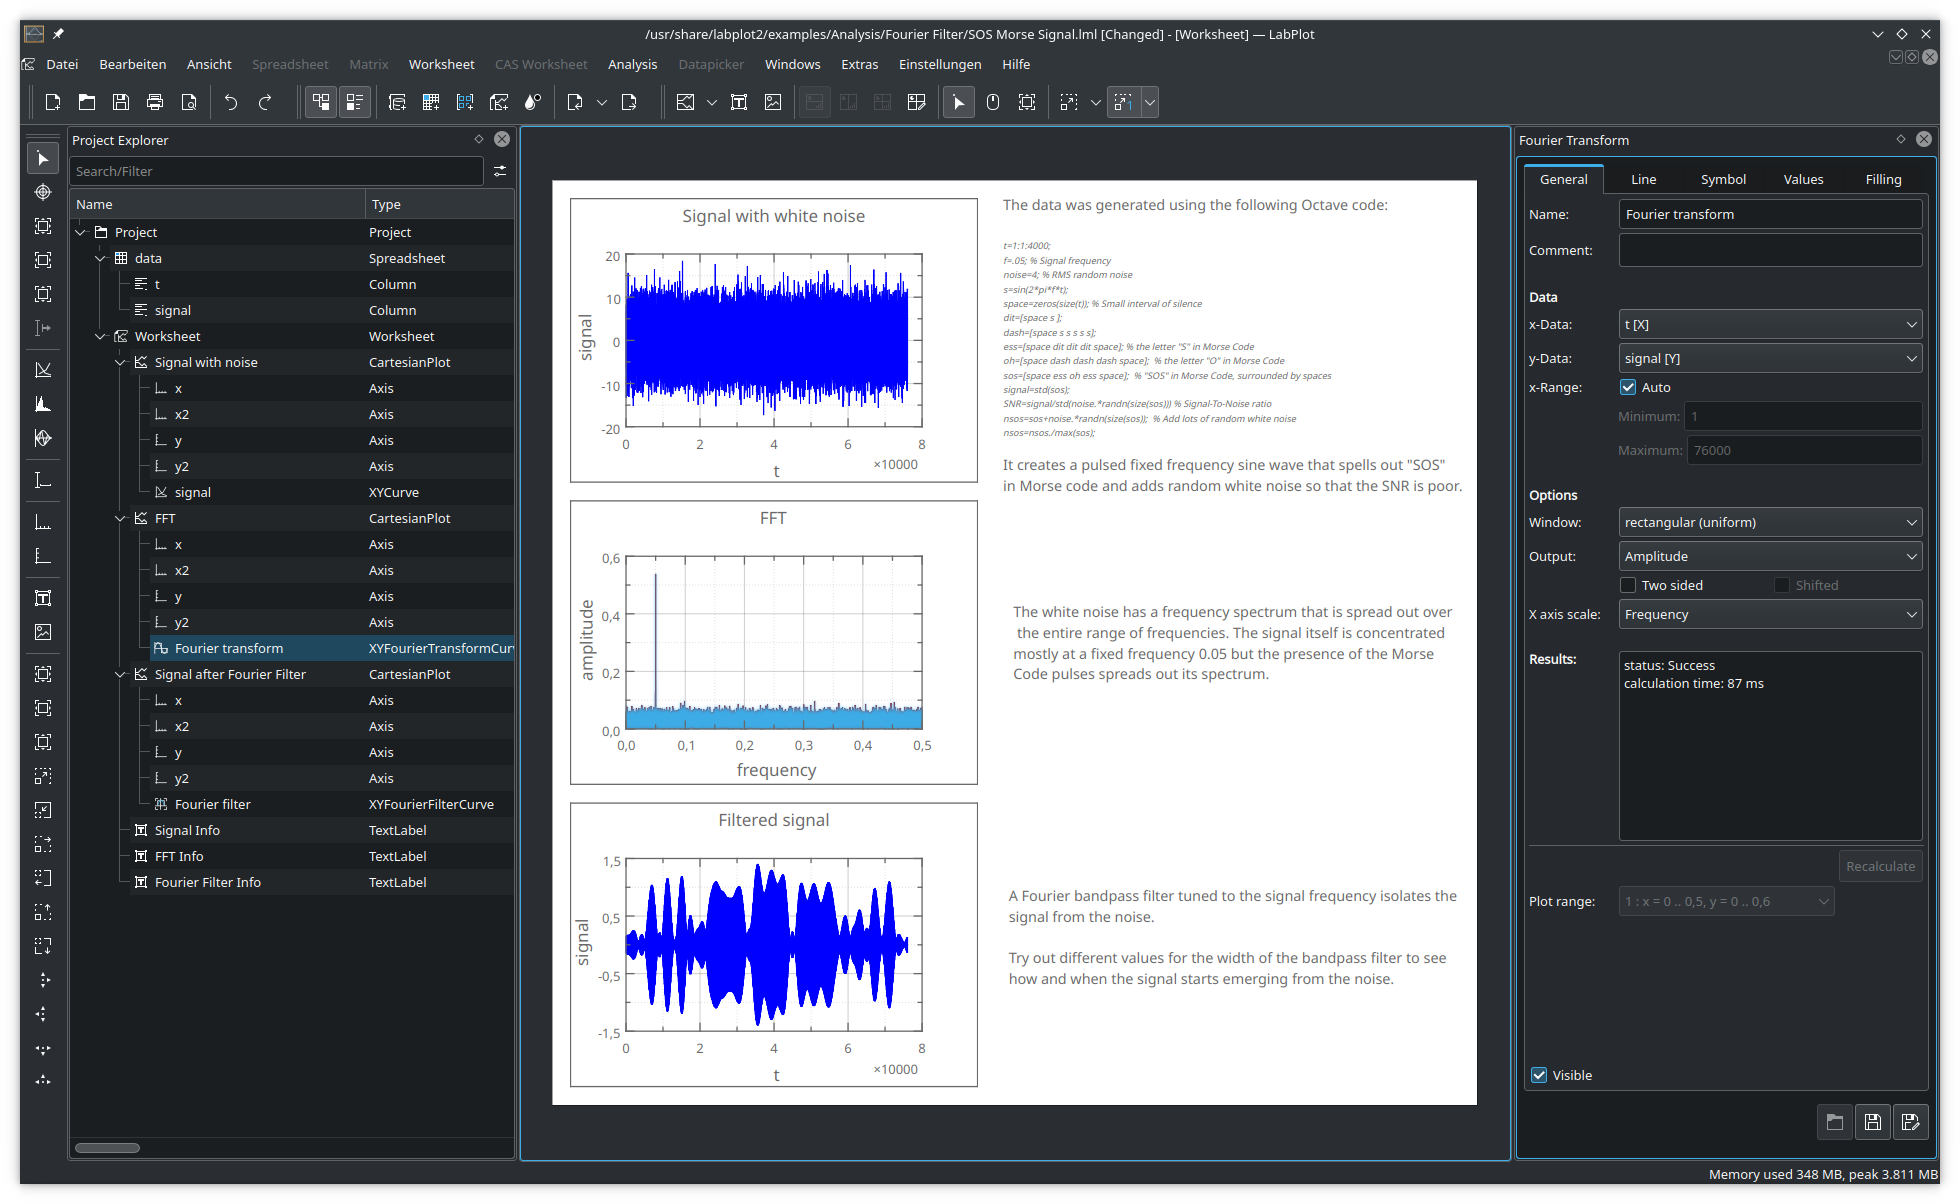
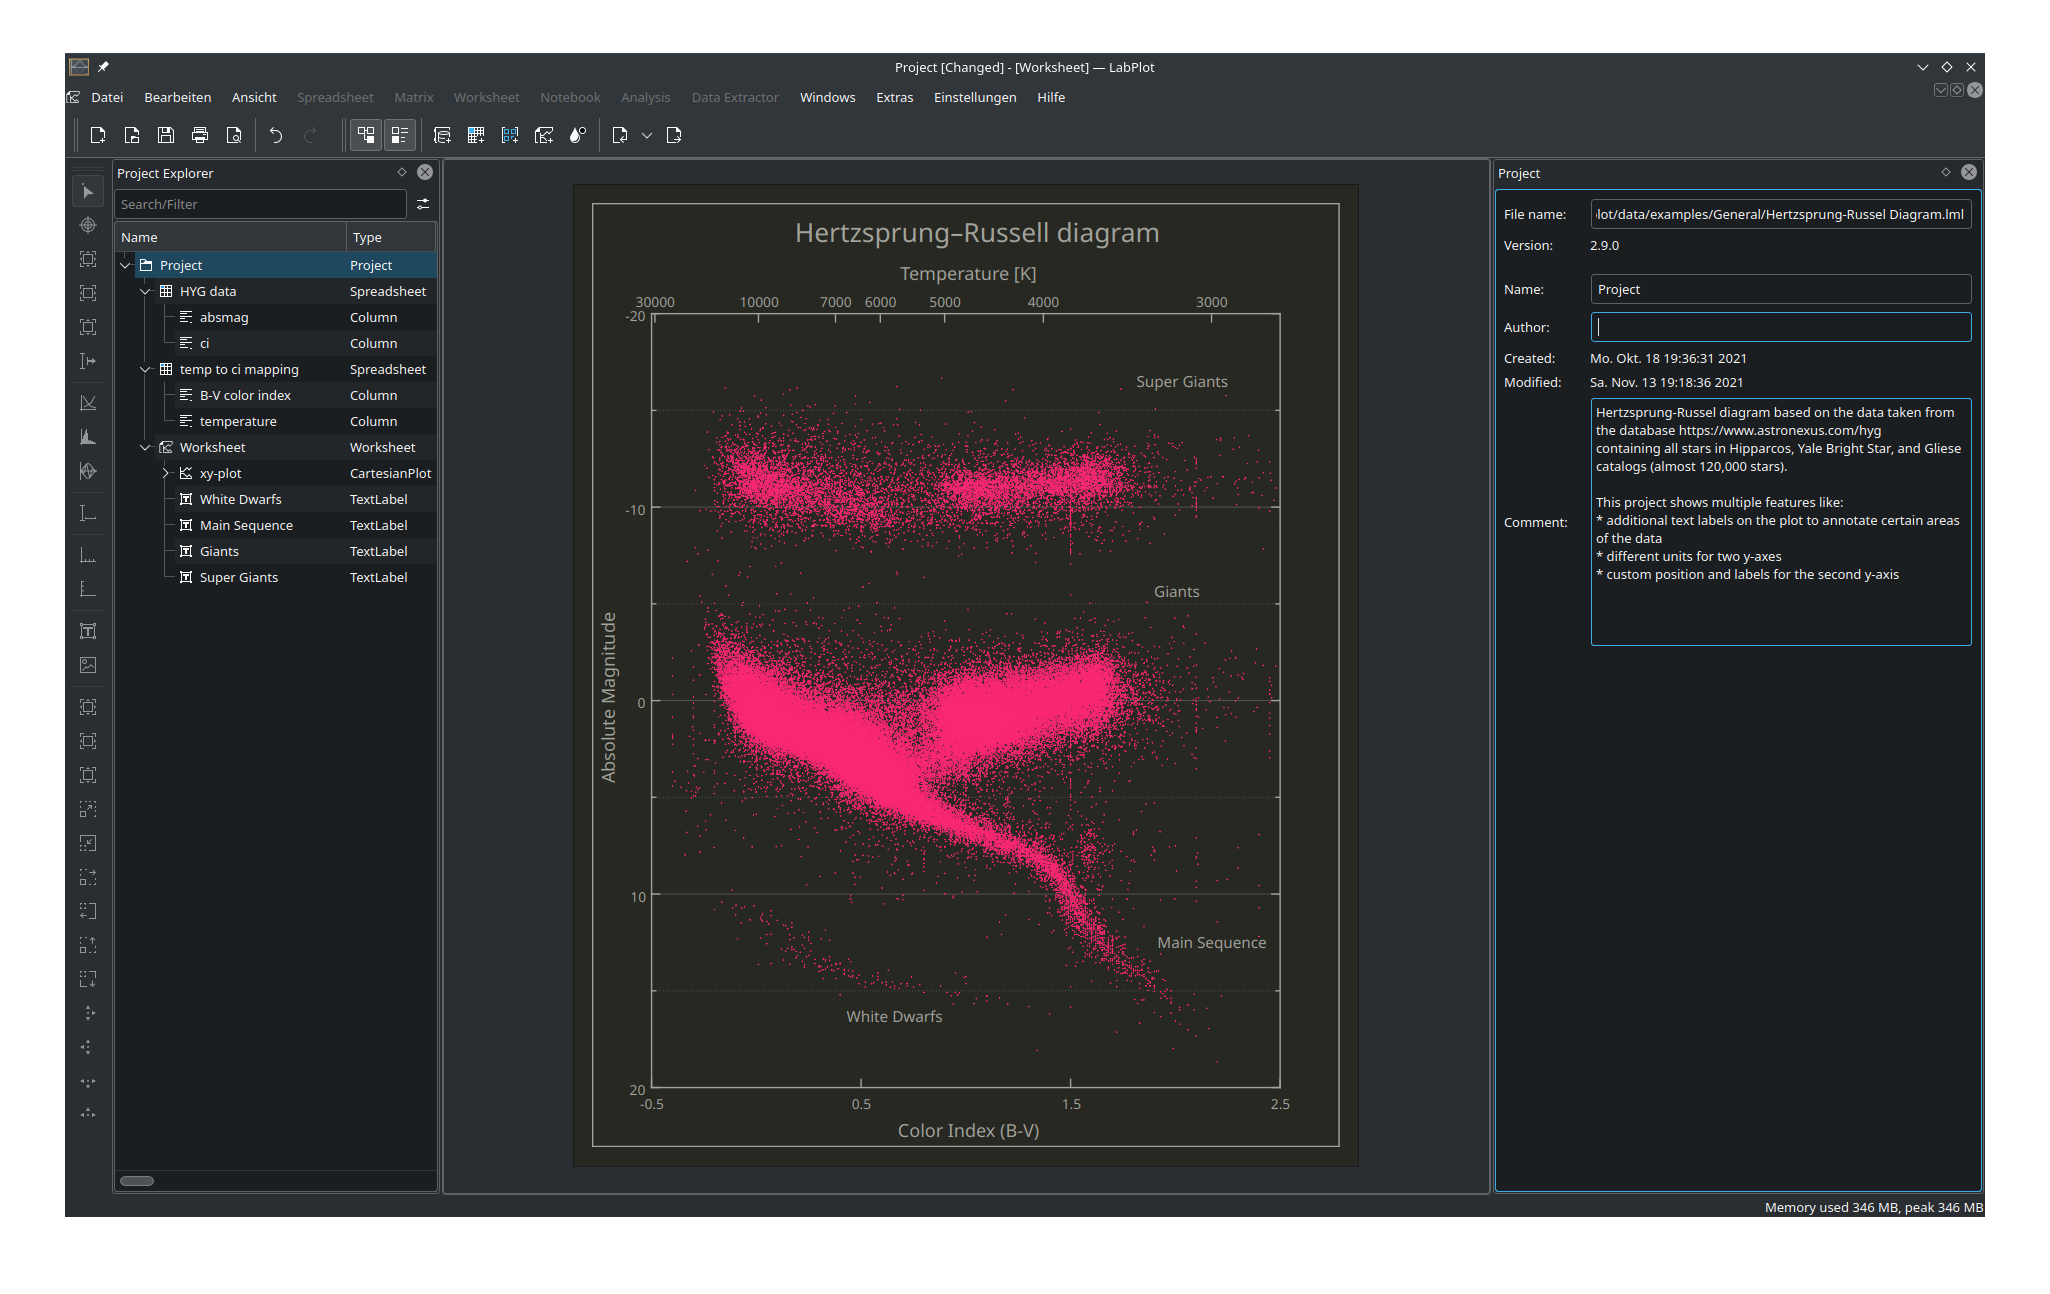
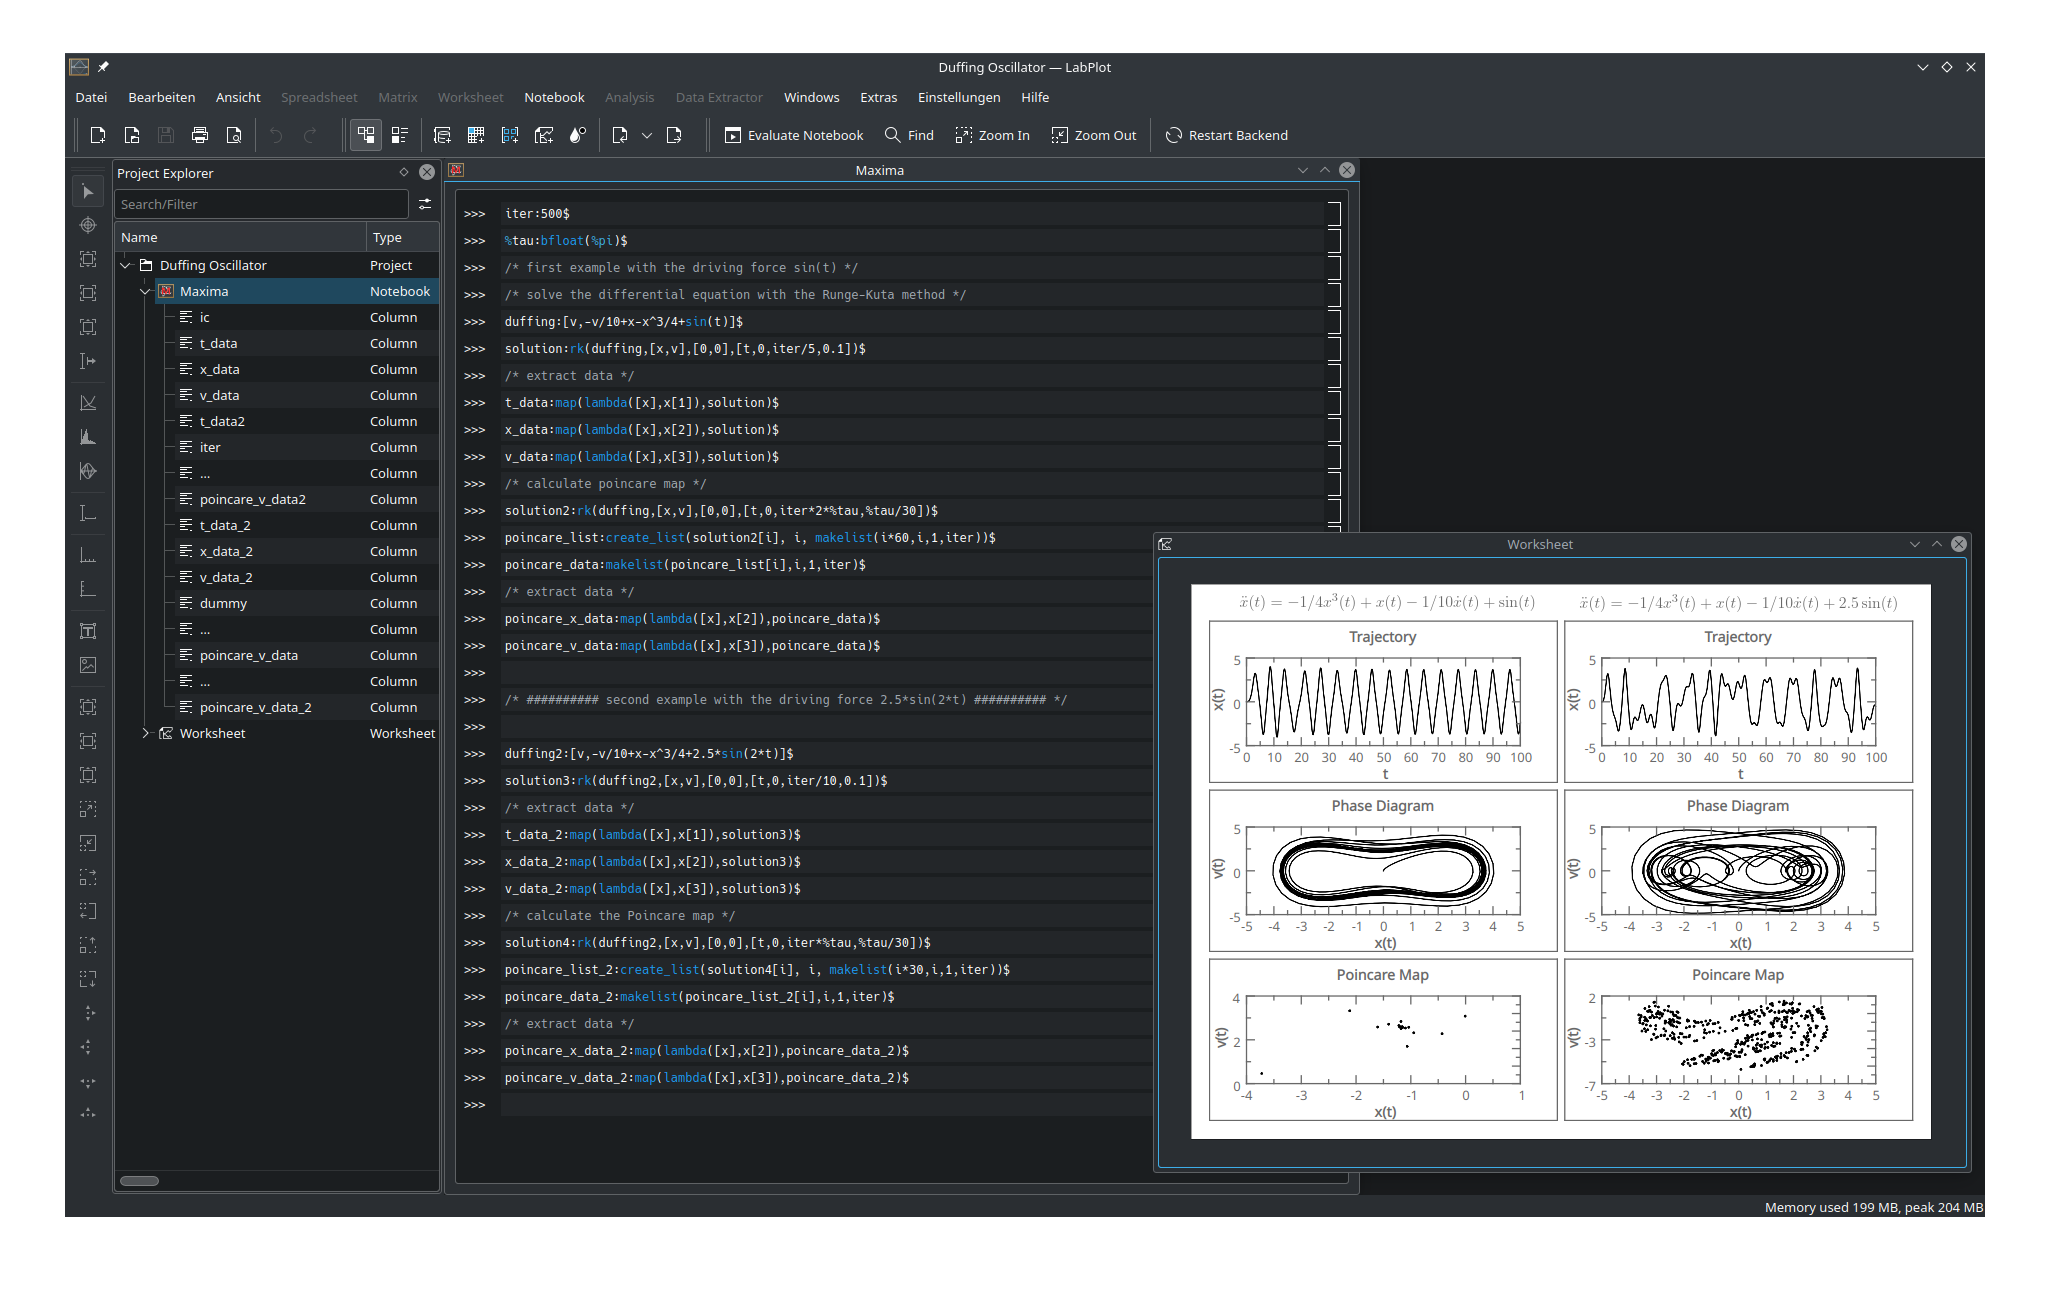
LabPlot je BEZPLATNÝ, open source a multiplatformový softvér na vizualizáciu a analýzu dát prístupný pre každého.
LabPlot poskytuje jednoduché možnosti na vytváranie, správu a úpravu nákresov. Umožní vám vyrobiť nákresy založené na údajoch z tabuľky alebo z údajov importovaných z externých súborov. Nákresy sa dajú exportovať do niekoľkých rastrových a vektorových grafických formátov.

Install on
Linux


Vydania RSS
2.12.1
2025-08-15
2.12.0
2025-04-25
2.11.1
2024-07-16
2.11.0
2024-07-09
2.10.1
2023-07-11
2.10.0
2023-03-21
2.9.0
2022-05-03
2.8.2
2021-04-01
2.8.1
2020-11-13
2.8.0
2020-09-16
Nočné inštalátory
Nočné inštalátory LabPlot sú tiež k dispozícii na stiahnutie z KDE CDN. Tieto verzie sú určené na testovacie účely. Zapojte sa a pomôžte nám ich vylepšiť!
Nestabilná verzia.
Vygenerované z najnovšej verzie vývojovej vetvy.