Kcachegrind
Kategorier: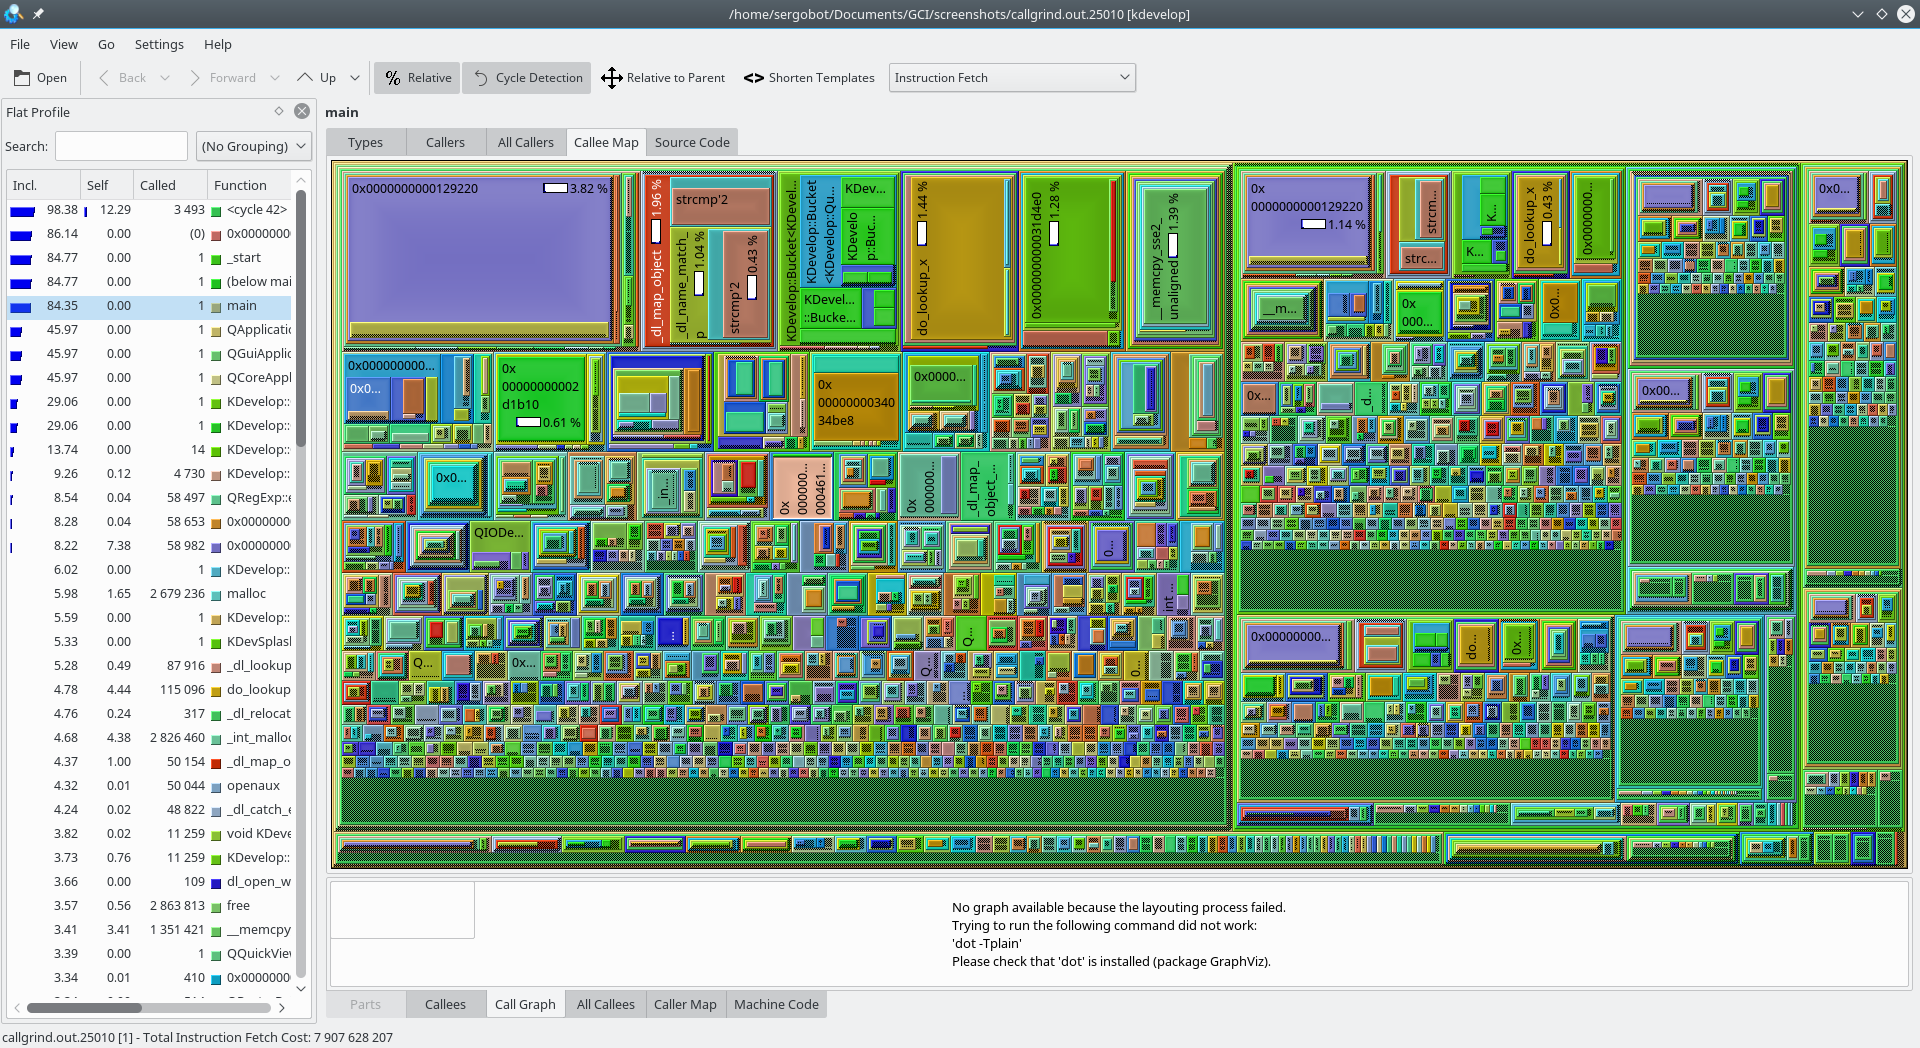
Kcachegrind; är ett visualiseringsverktyg för profileringsdata, använt för att ta reda på delarna med störst tidsåtgång vid körning av ett program.
Funktioner:
- Kcachegrind åskådliggör profiler (dvs. körtidskarakteristik) för program på olika sätt, inklusive åskådliggörande av anropsdiagram och annotering med källkod och disassembler.
- Det kan läsa in profiler skapade av cachesimulatorn och anropsspåraren Calltree, ett Valgrind-verktyg. Sålunda behöver inte profilering någon förberedelse, kan hantera delade bibliotek och arkitekturer med insticksprogram, och påverkar inte själva mätningen.
- Konverterar skript för OProfile, Perl och PHP.
- Byter mellan flera visualiseringslayouter.
- Anropsdiagram kan exporteras som bild (PNG).
- Visar samtidigt två händelsetyper i anrops- och annoteringsvyer.

Installera på
Linux


Utgåvor RSS
26.04.0
2026-04-16
25.12.3
2026-03-05
25.12.2
2026-02-05
25.12.1
2026-01-08
25.12.0
2025-12-11
25.08.3
2025-11-06
25.08.2
2025-10-09
25.08.1
2025-09-11
25.08.0
2025-08-14
25.04.3
2025-07-03
25.04.2
2025-06-05
25.04.1
2025-05-08
25.04.0
2025-04-17
24.12.3
2025-03-06
24.12.2
2025-02-06
24.12.1
2025-01-09
24.12.0
2024-12-12
24.08.3
2024-11-07
24.08.2
2024-10-10
24.08.1
2024-09-12
24.08.0
2024-08-22
24.05.2
2024-07-04
24.05.1
2024-06-13
24.05.0
2024-05-23
24.02.2
2024-04-11
24.02.1
2024-03-21
24.02.0
2024-02-28
23.08.5
2024-02-15