跳至内容

LabPlot

分类:   教育 其他平台:   macOS | Windows
Basic visualization of data
Advanced layouting of plots and images
Theming
Visualization of mathematical functions
Fit pre-defined or custom models to the data
Smooth the data with the help of various smoothing methods
Notebook interface for interactive sessions in Maxima, Octave, R, Sage, Scilab, Python, Julia, etc
Signal analysis
Herzsprung-Russel diagram in LabPlot
Visualization of data calculated in an interactive Maxima session

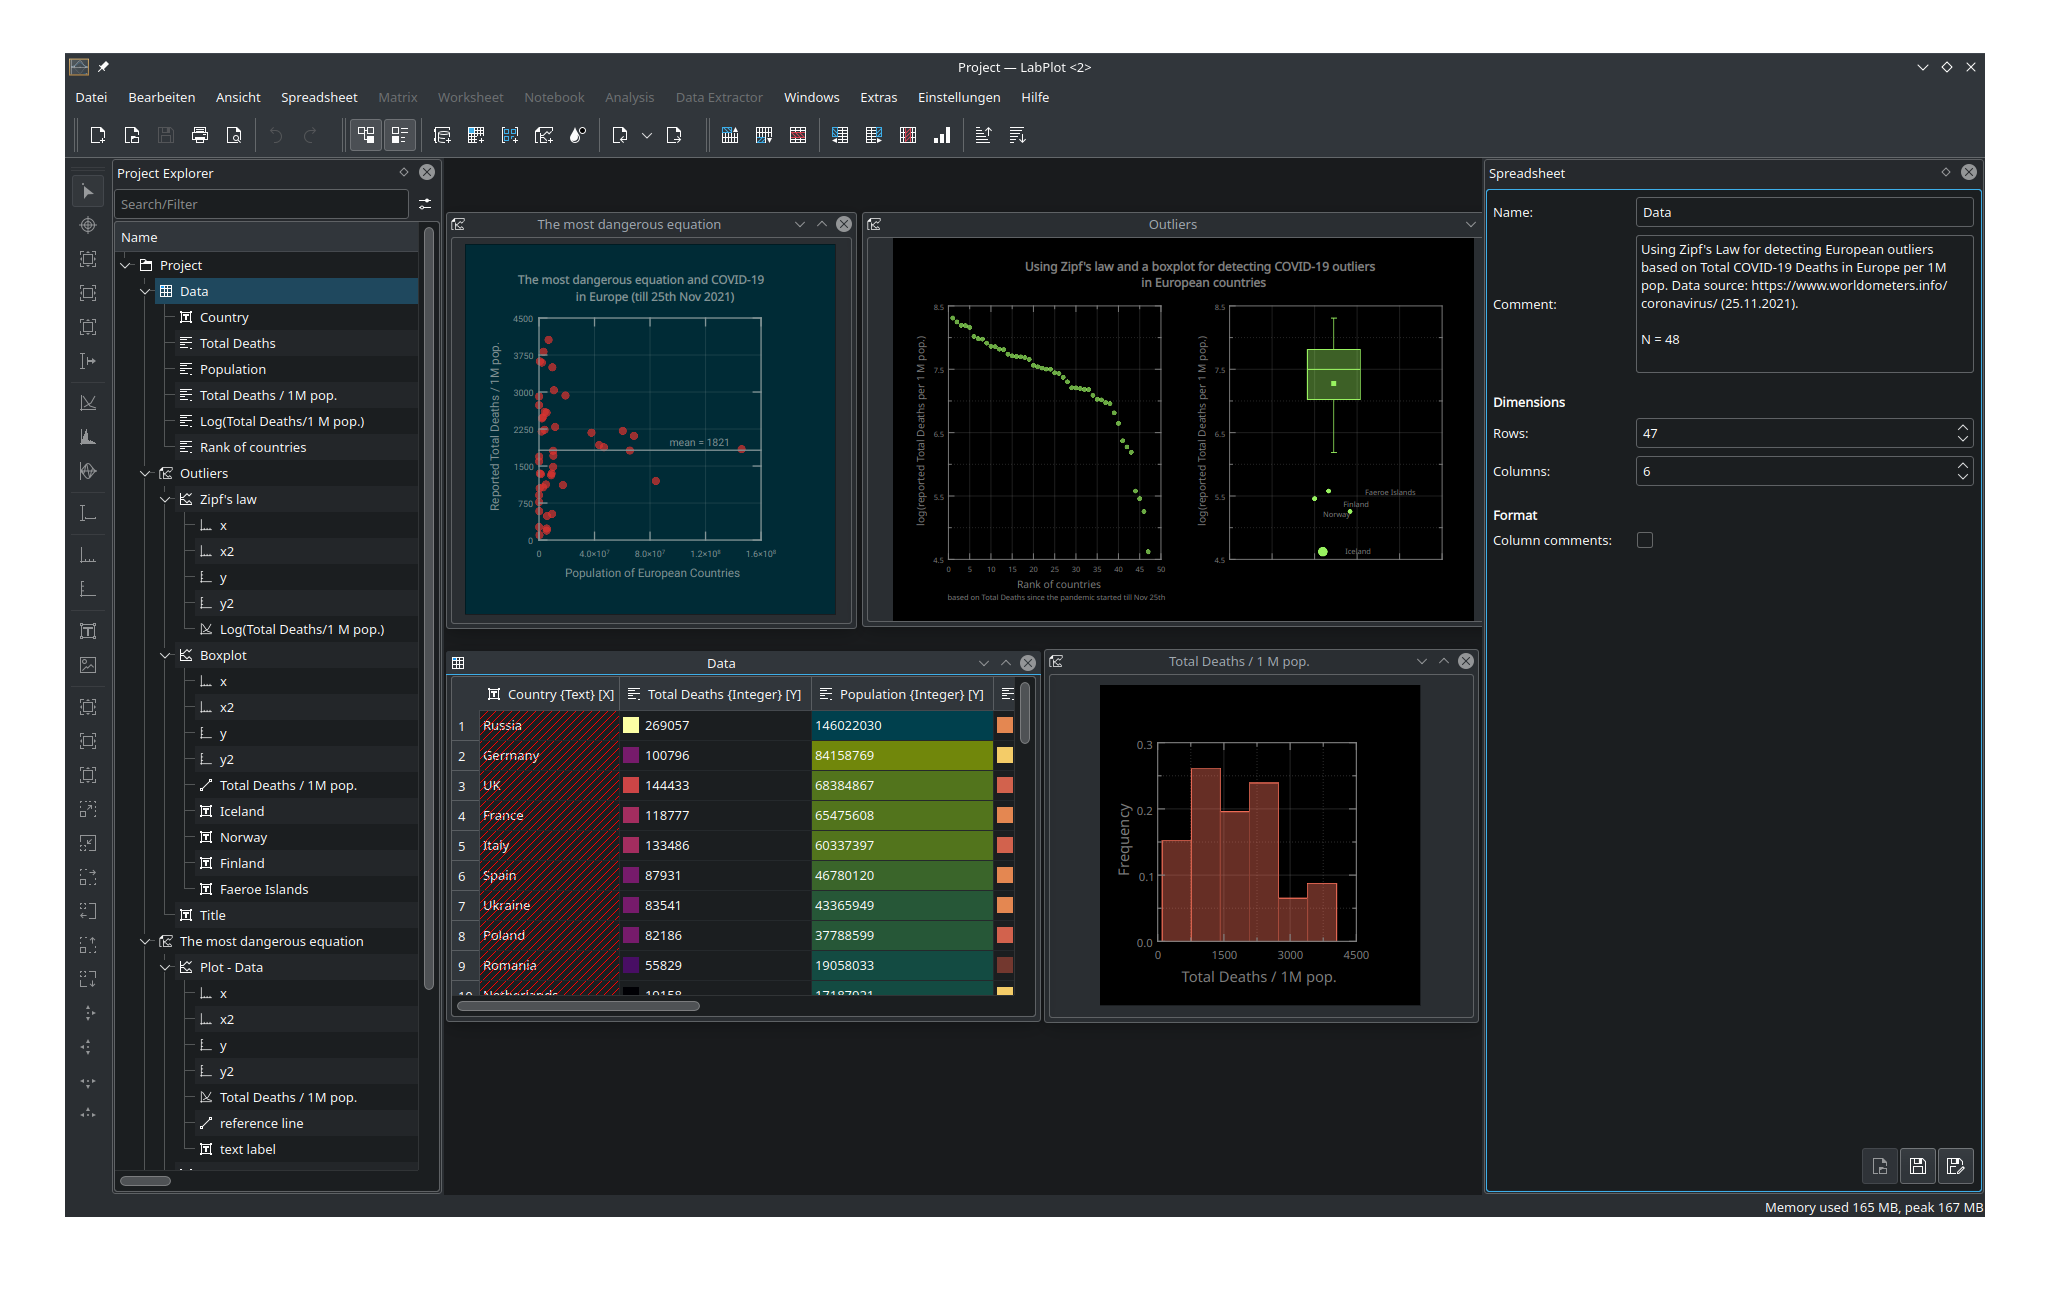
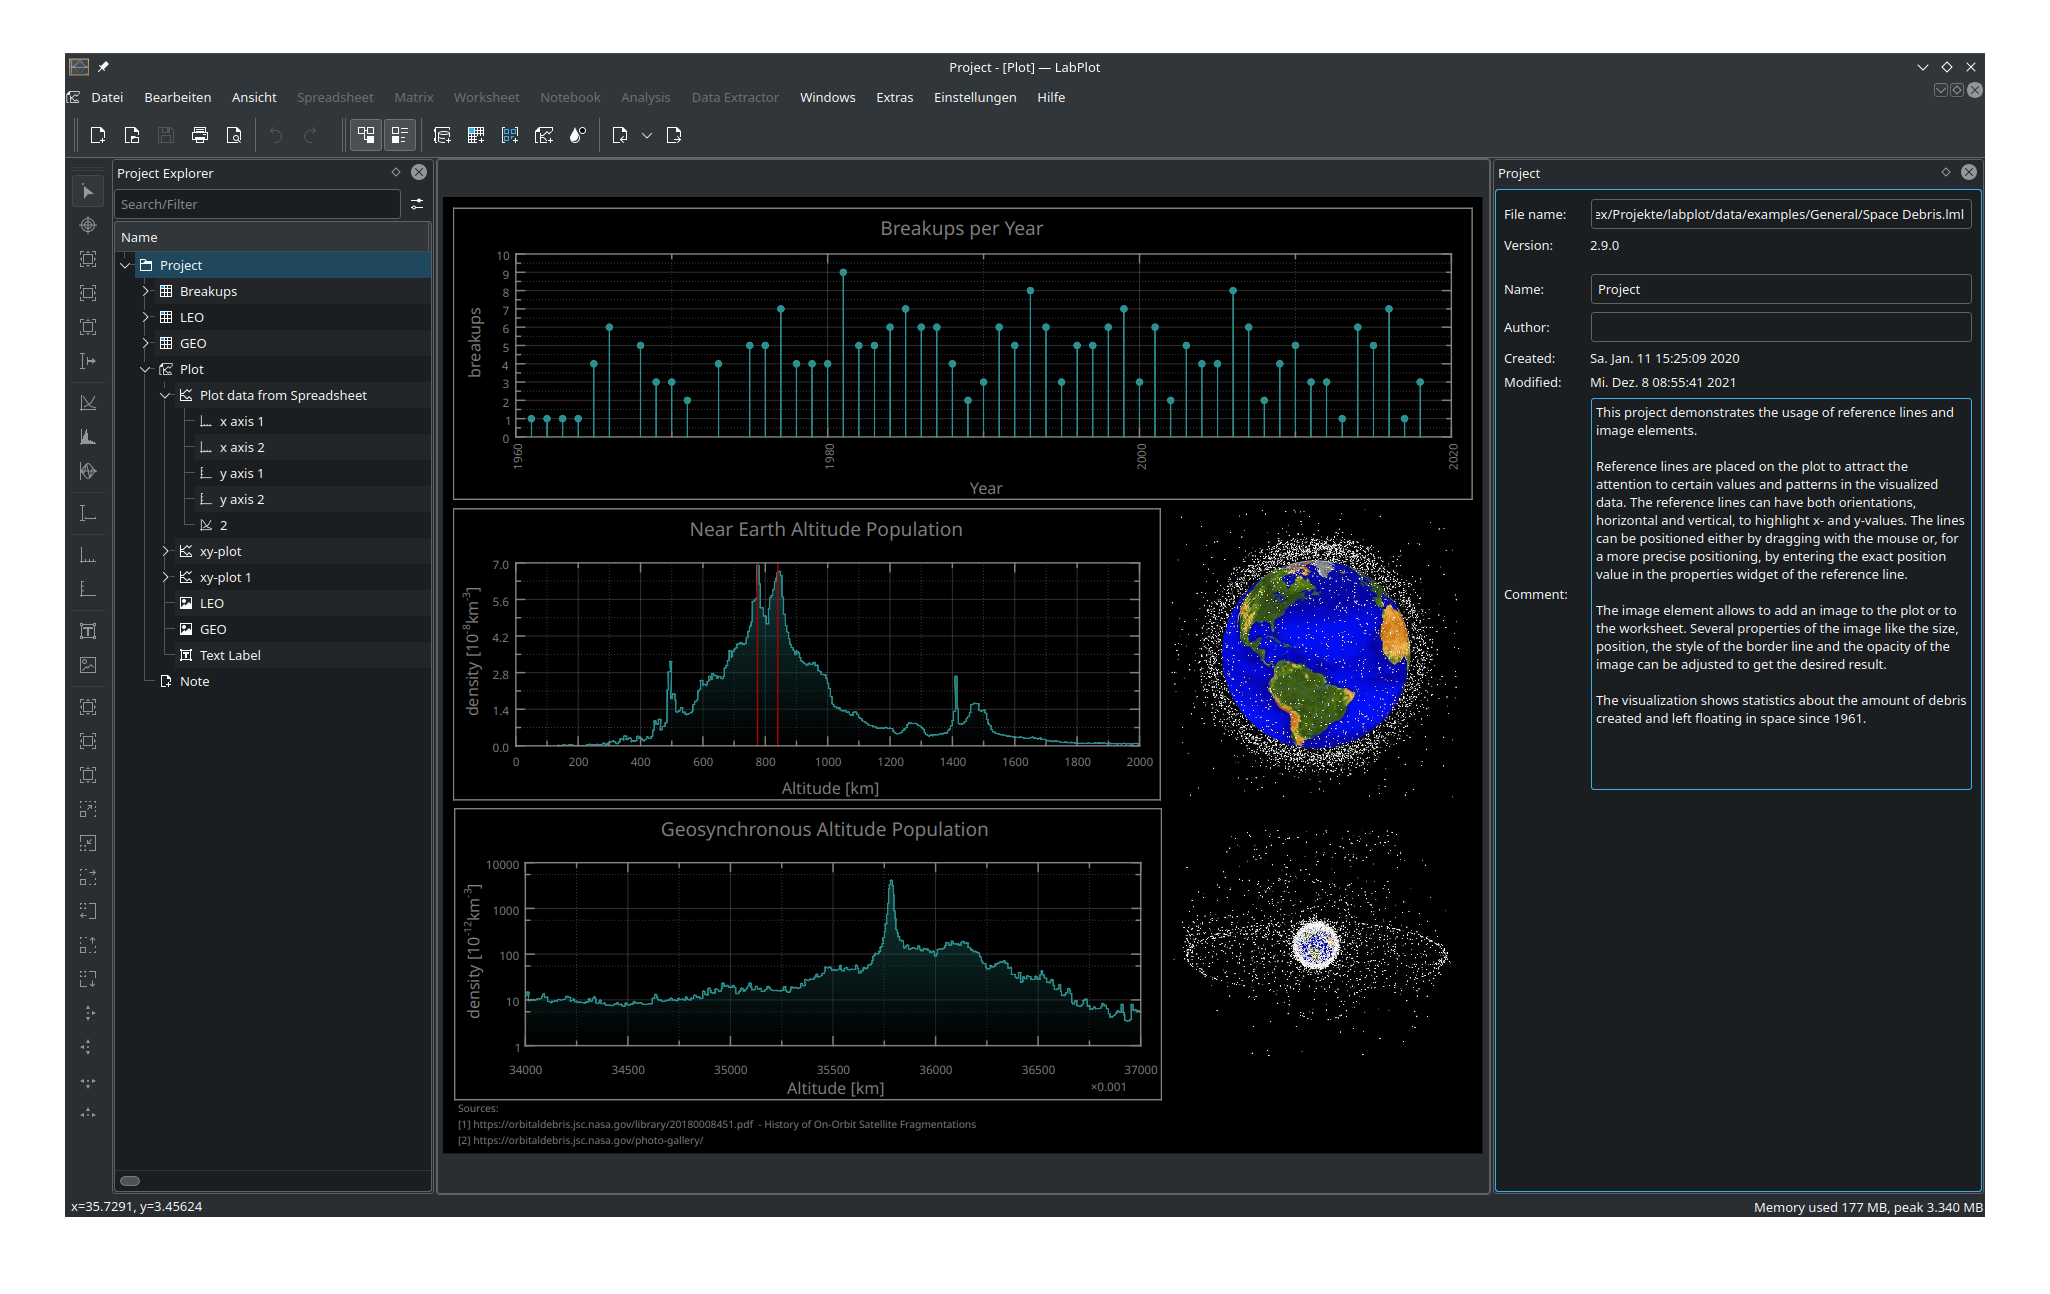
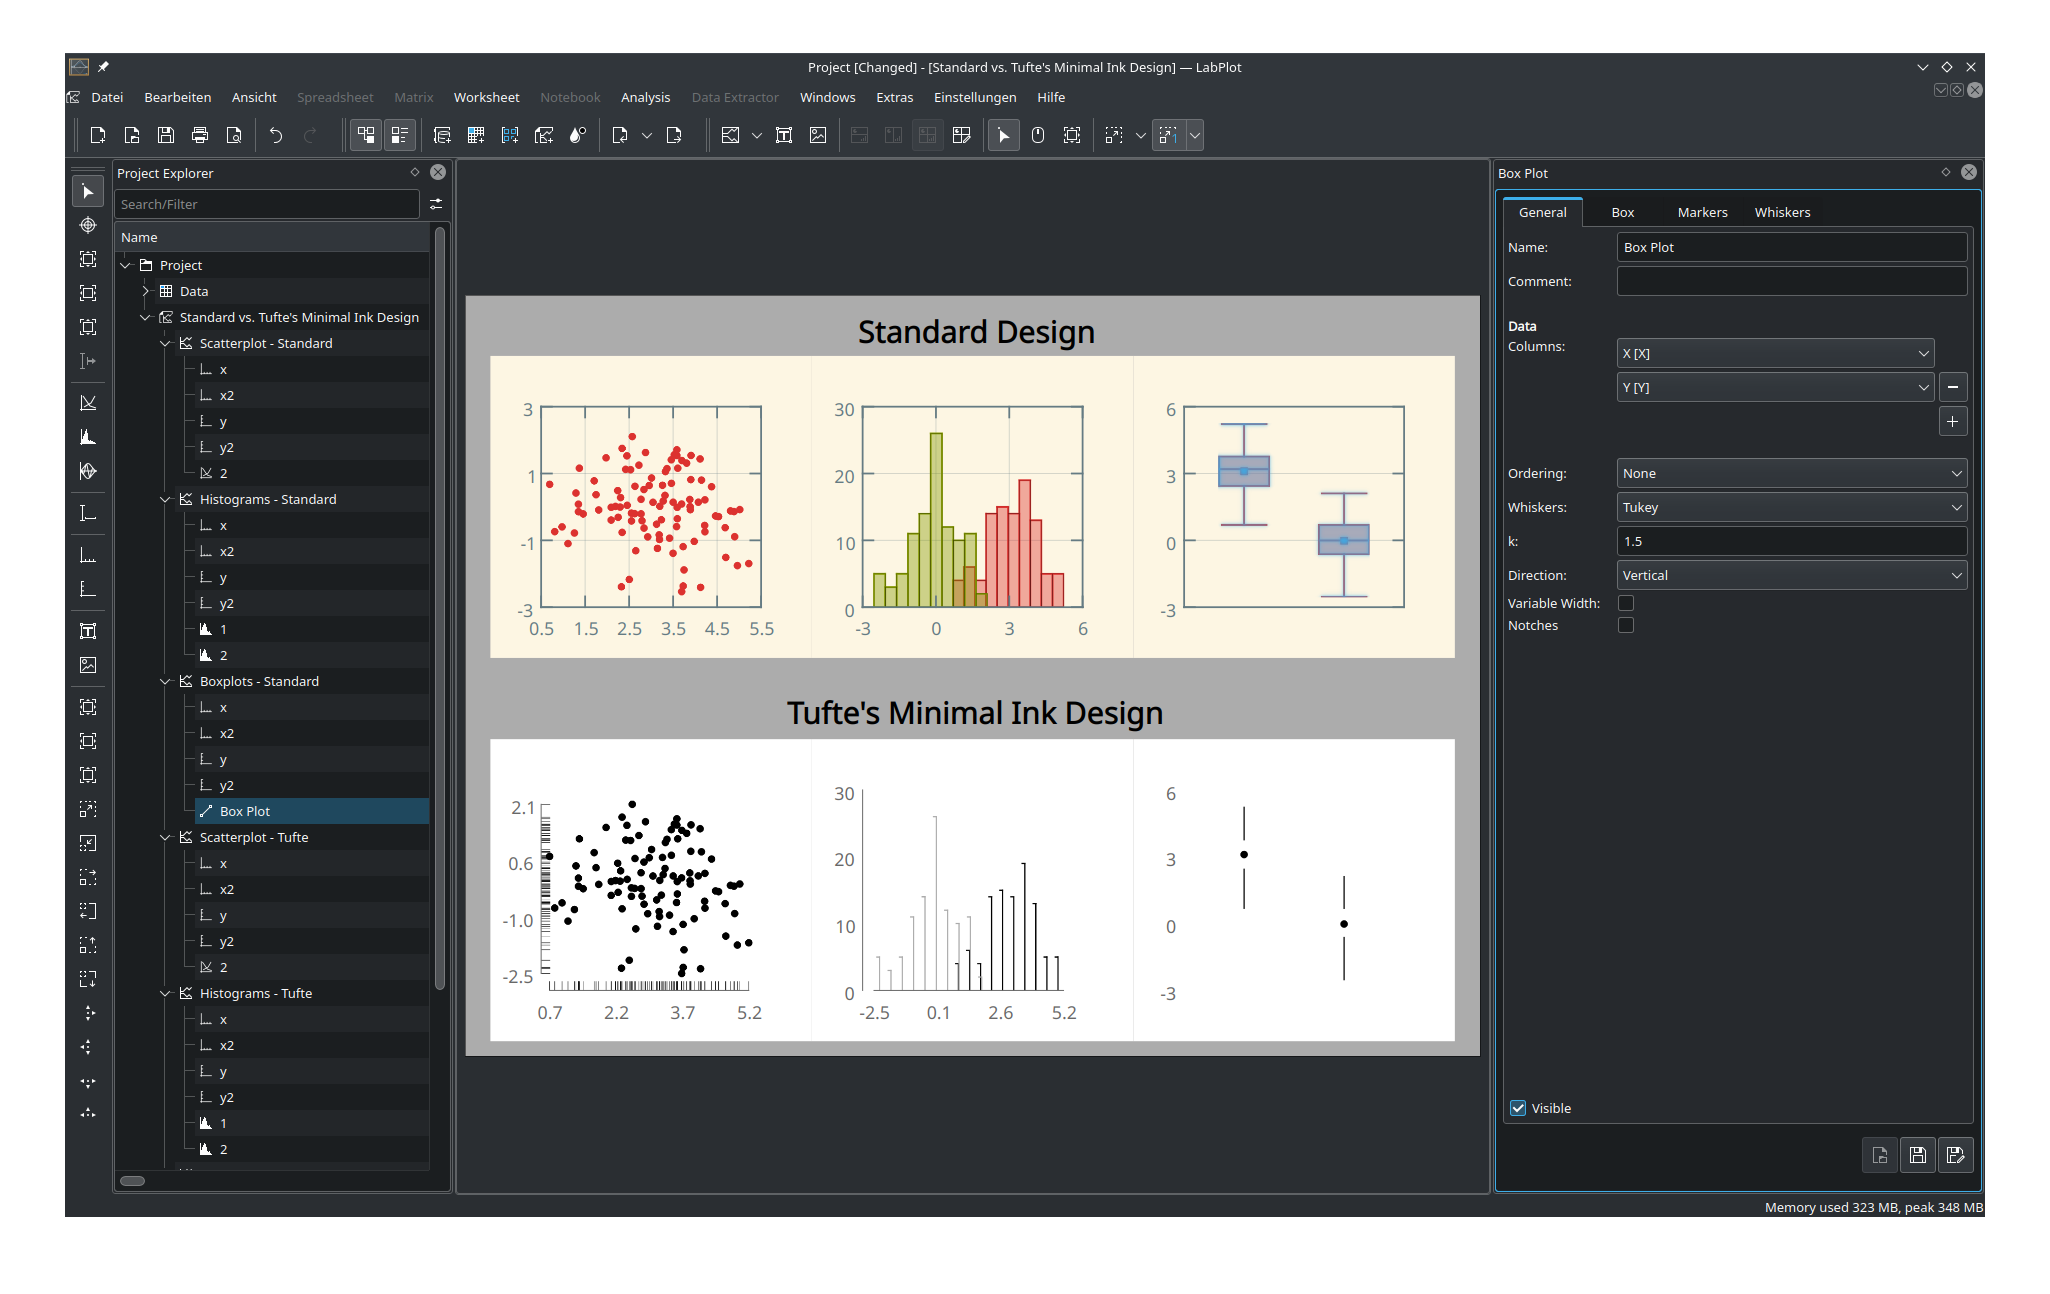
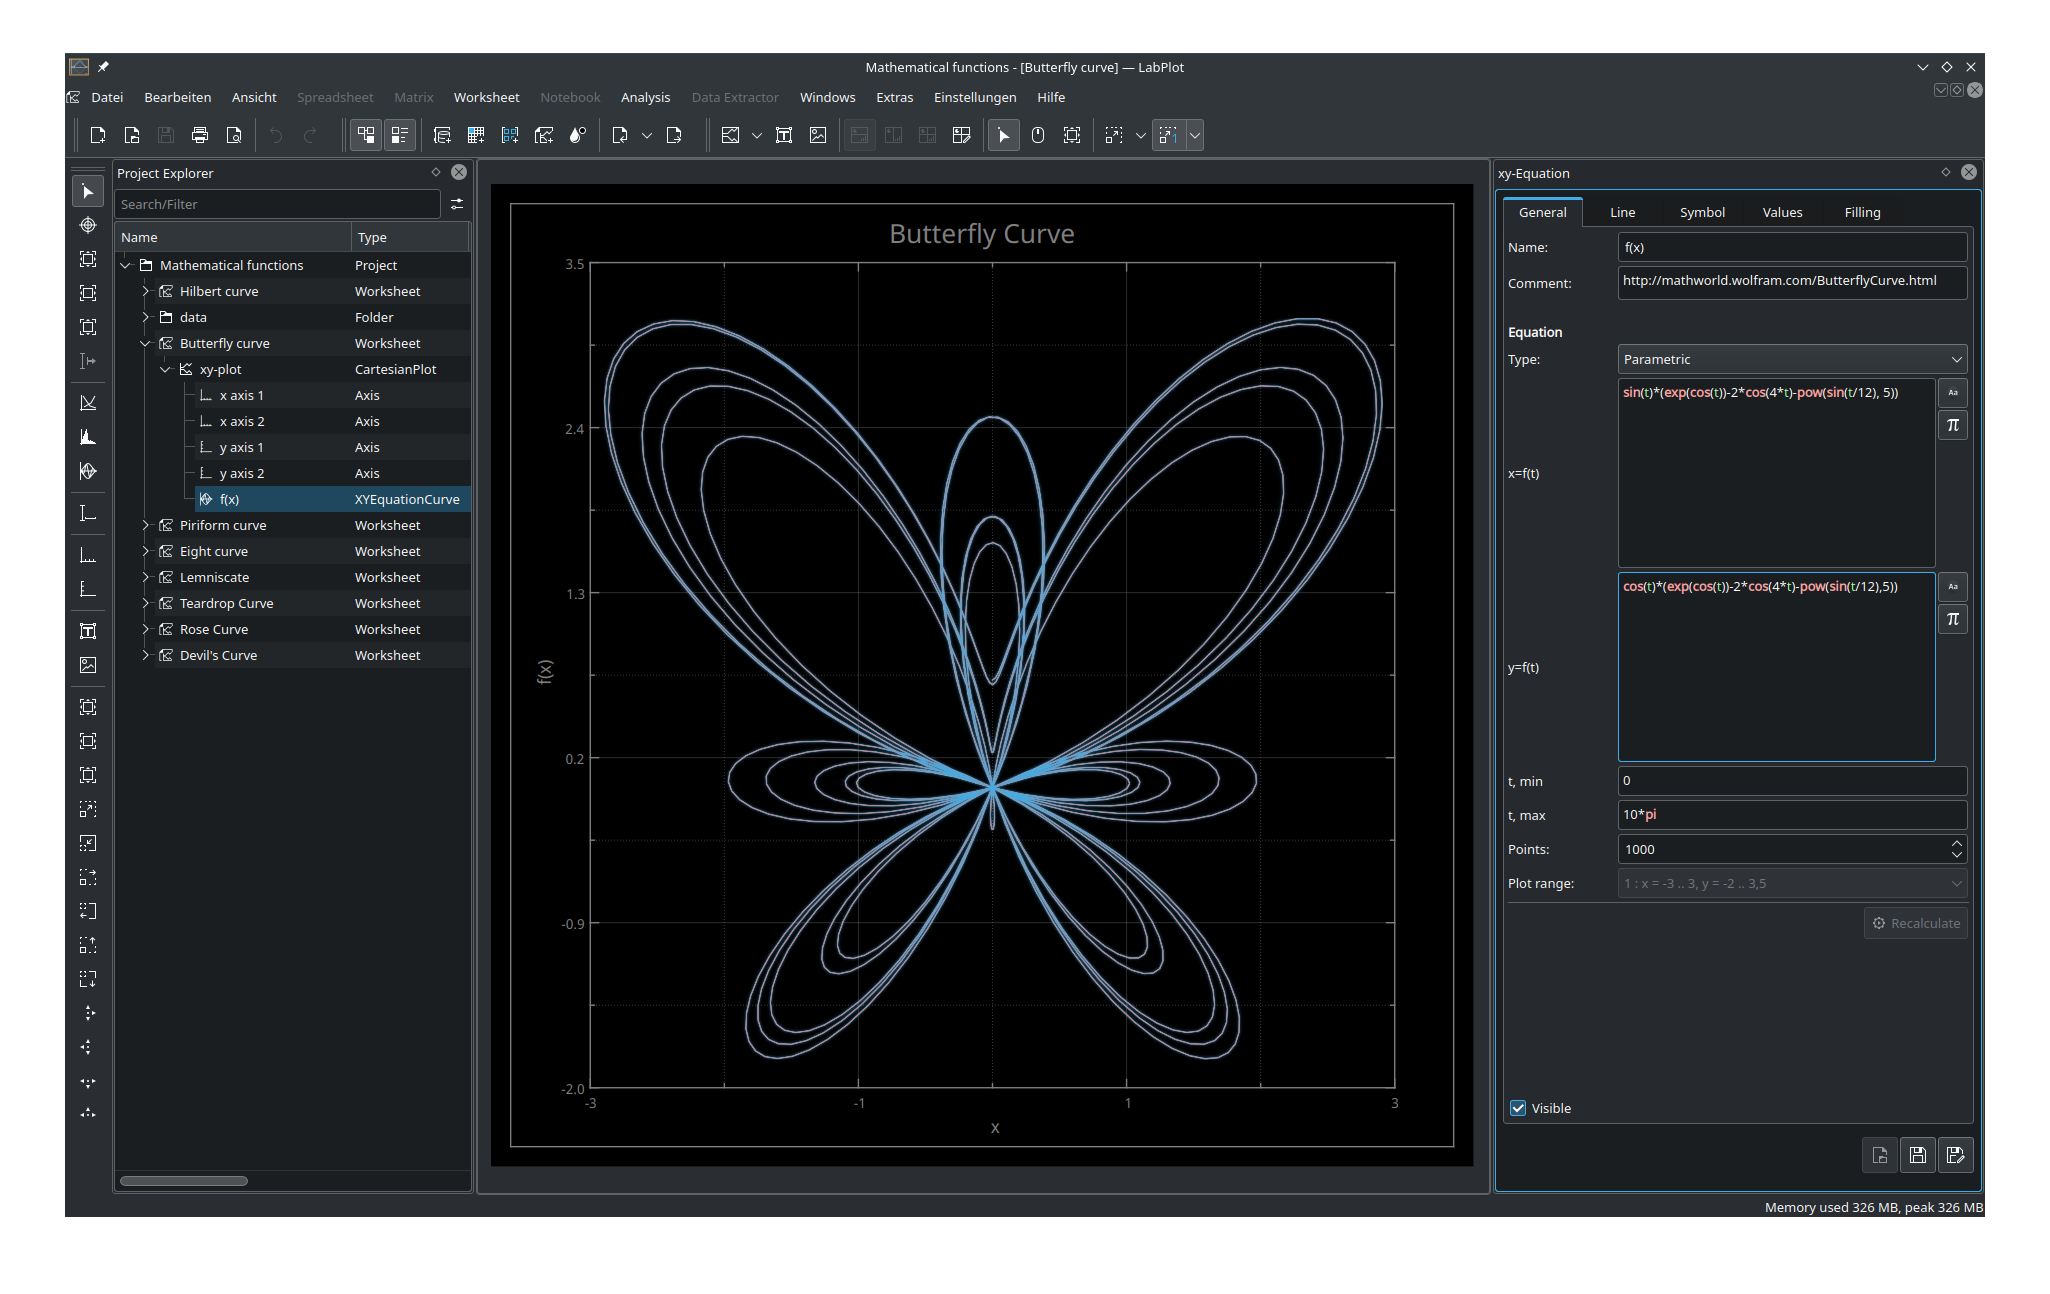
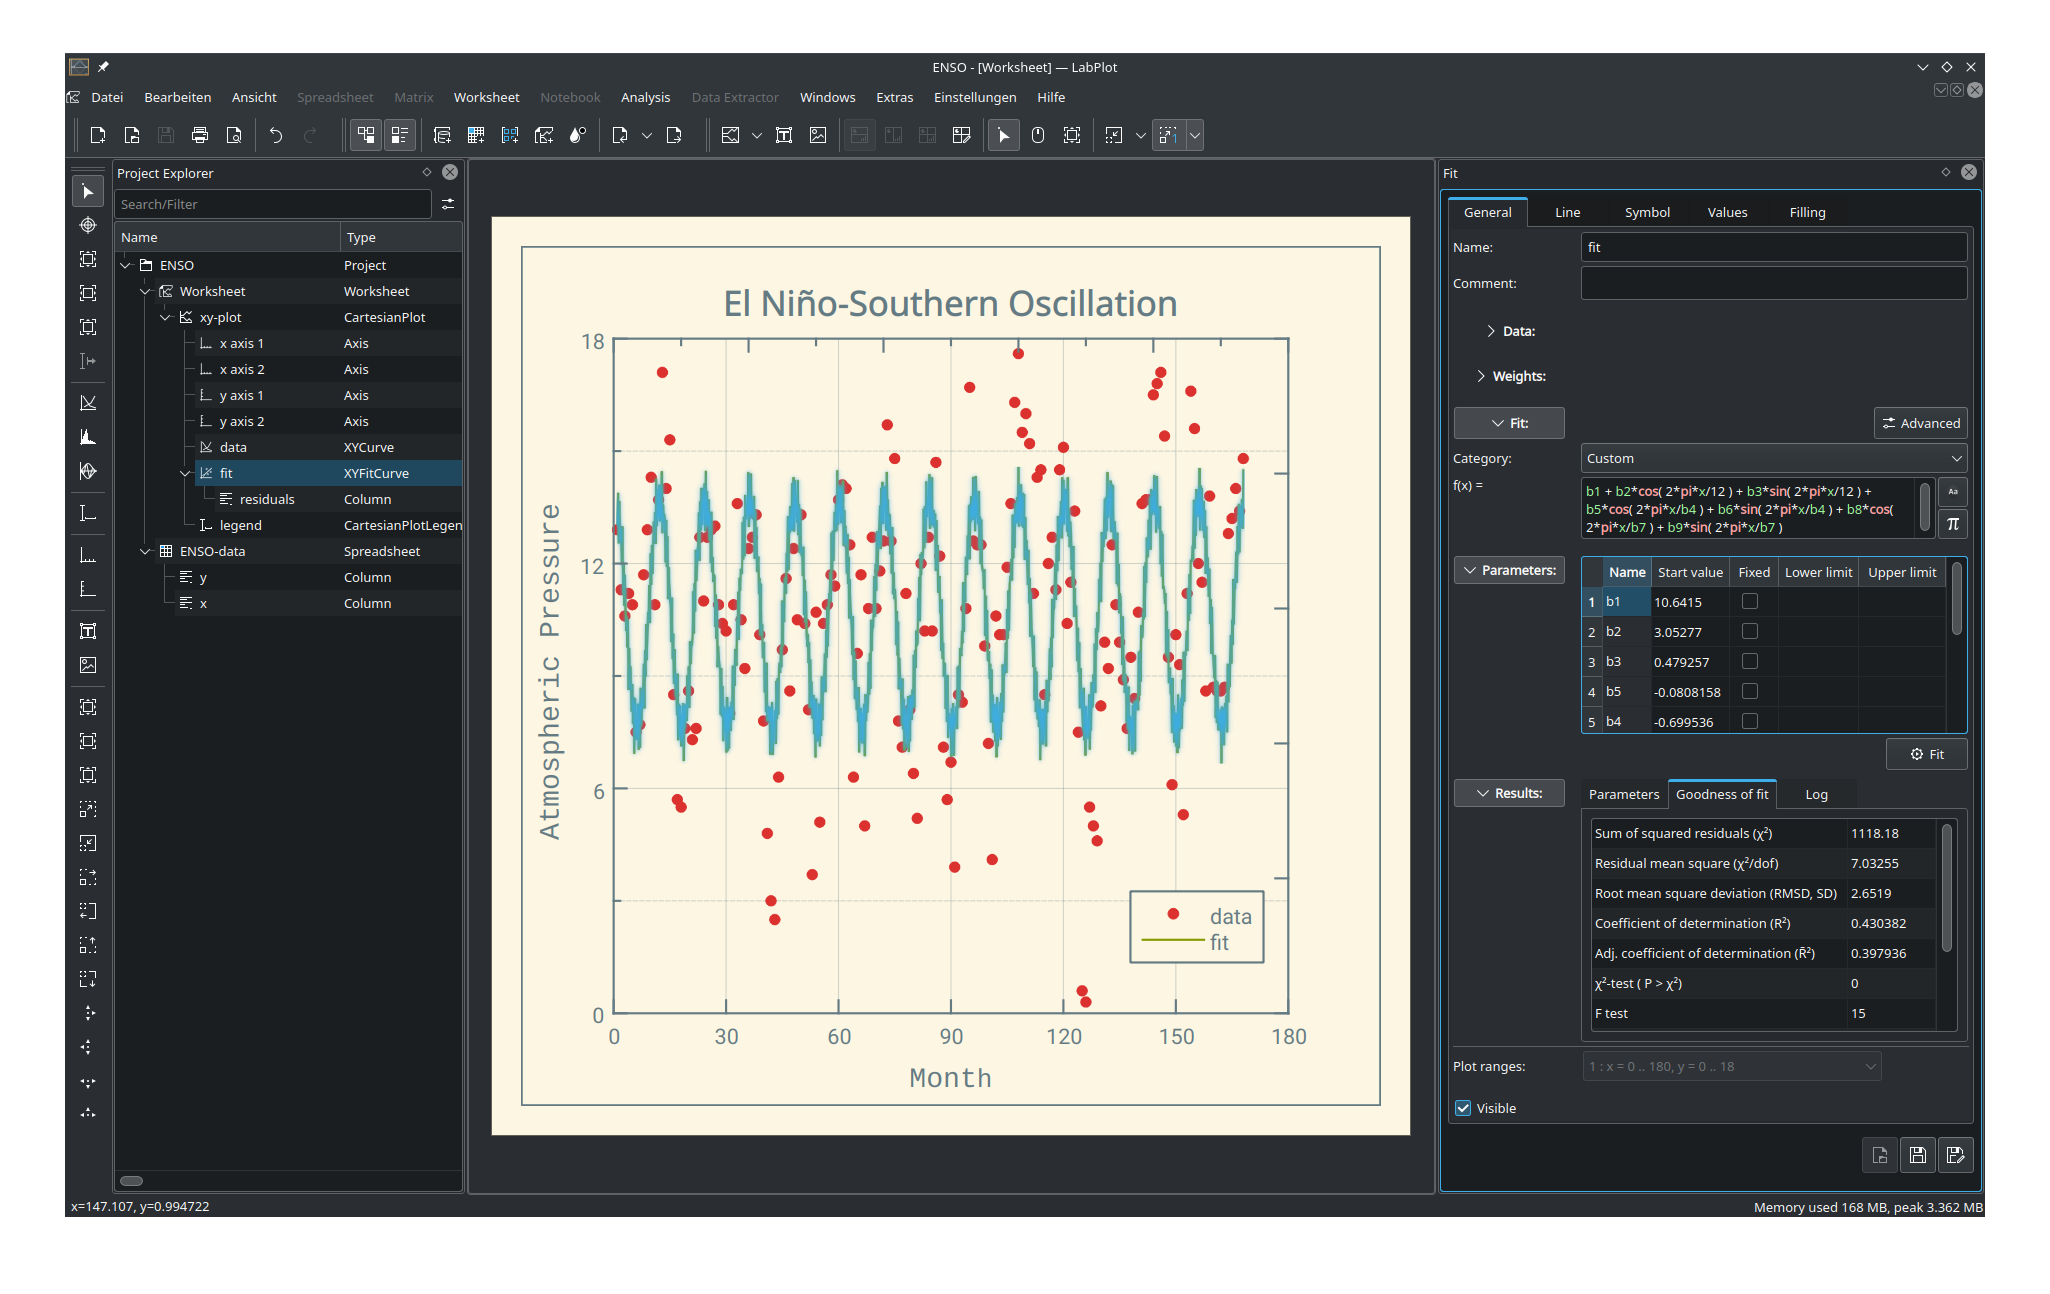
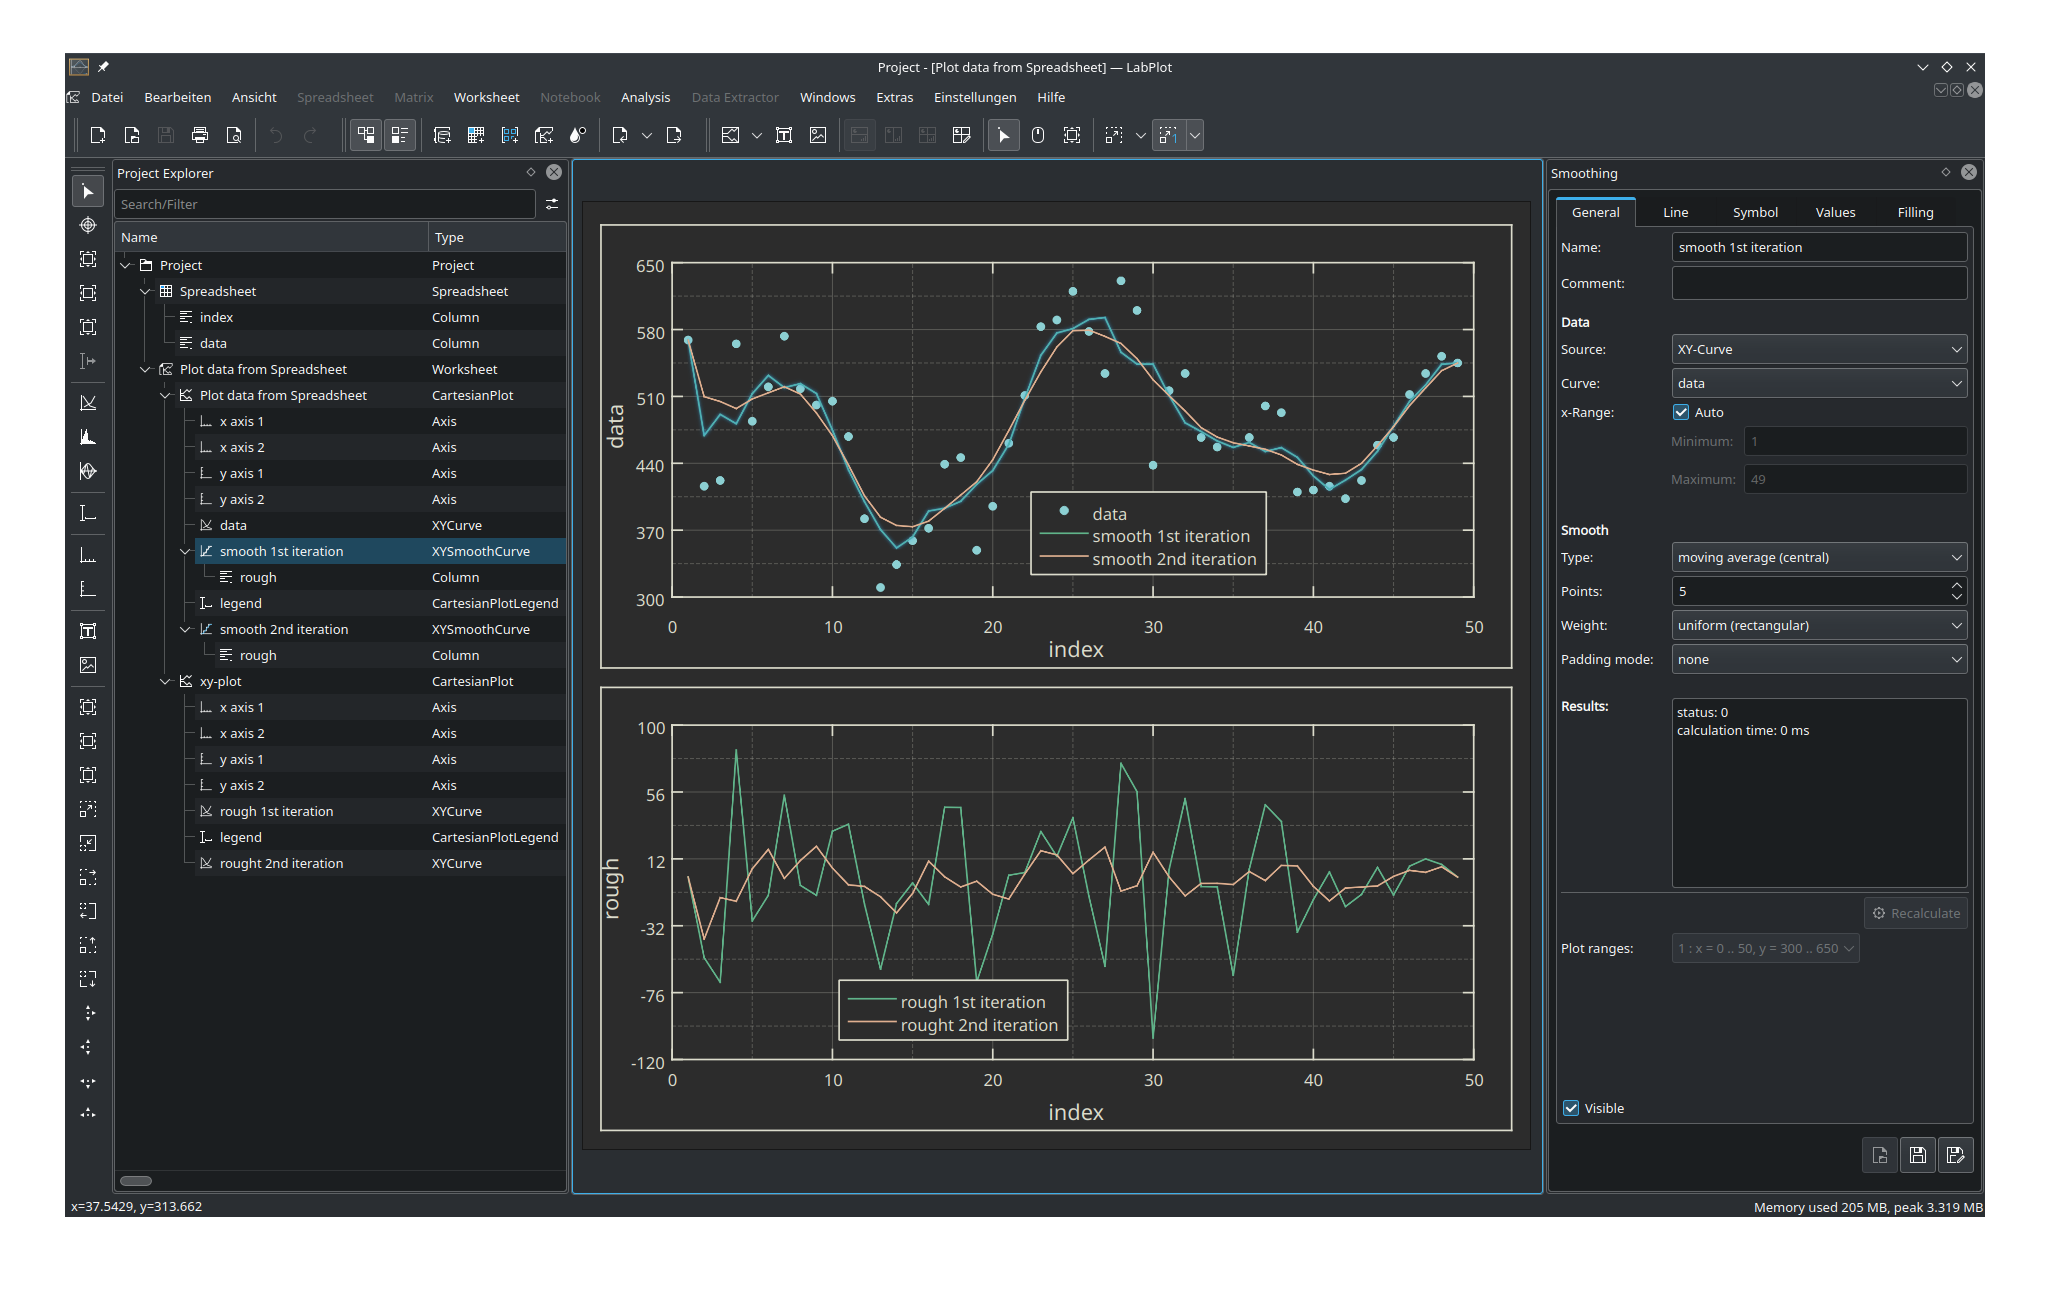
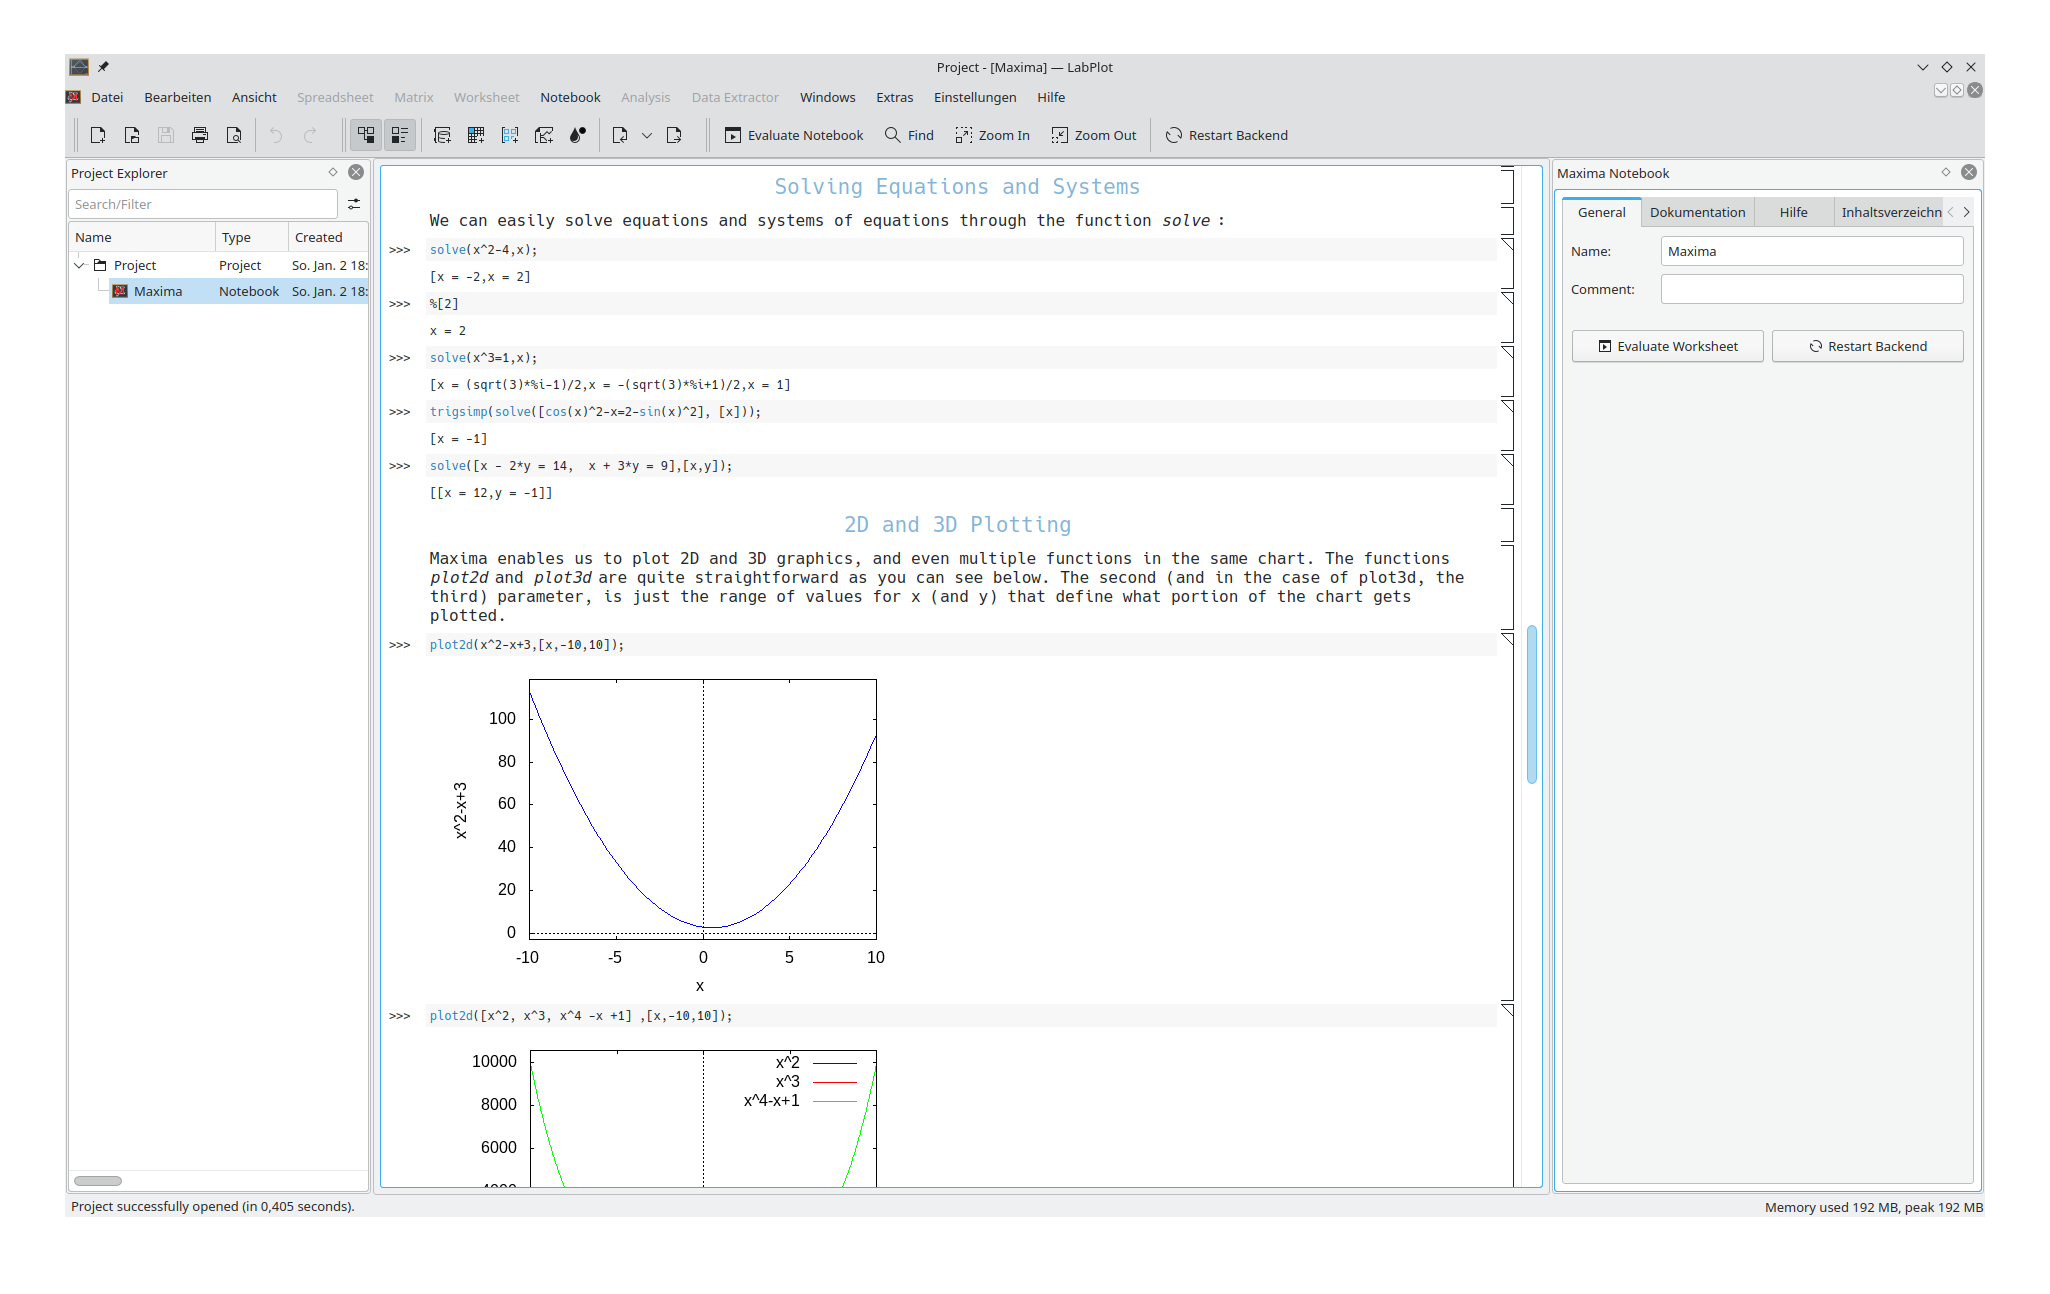
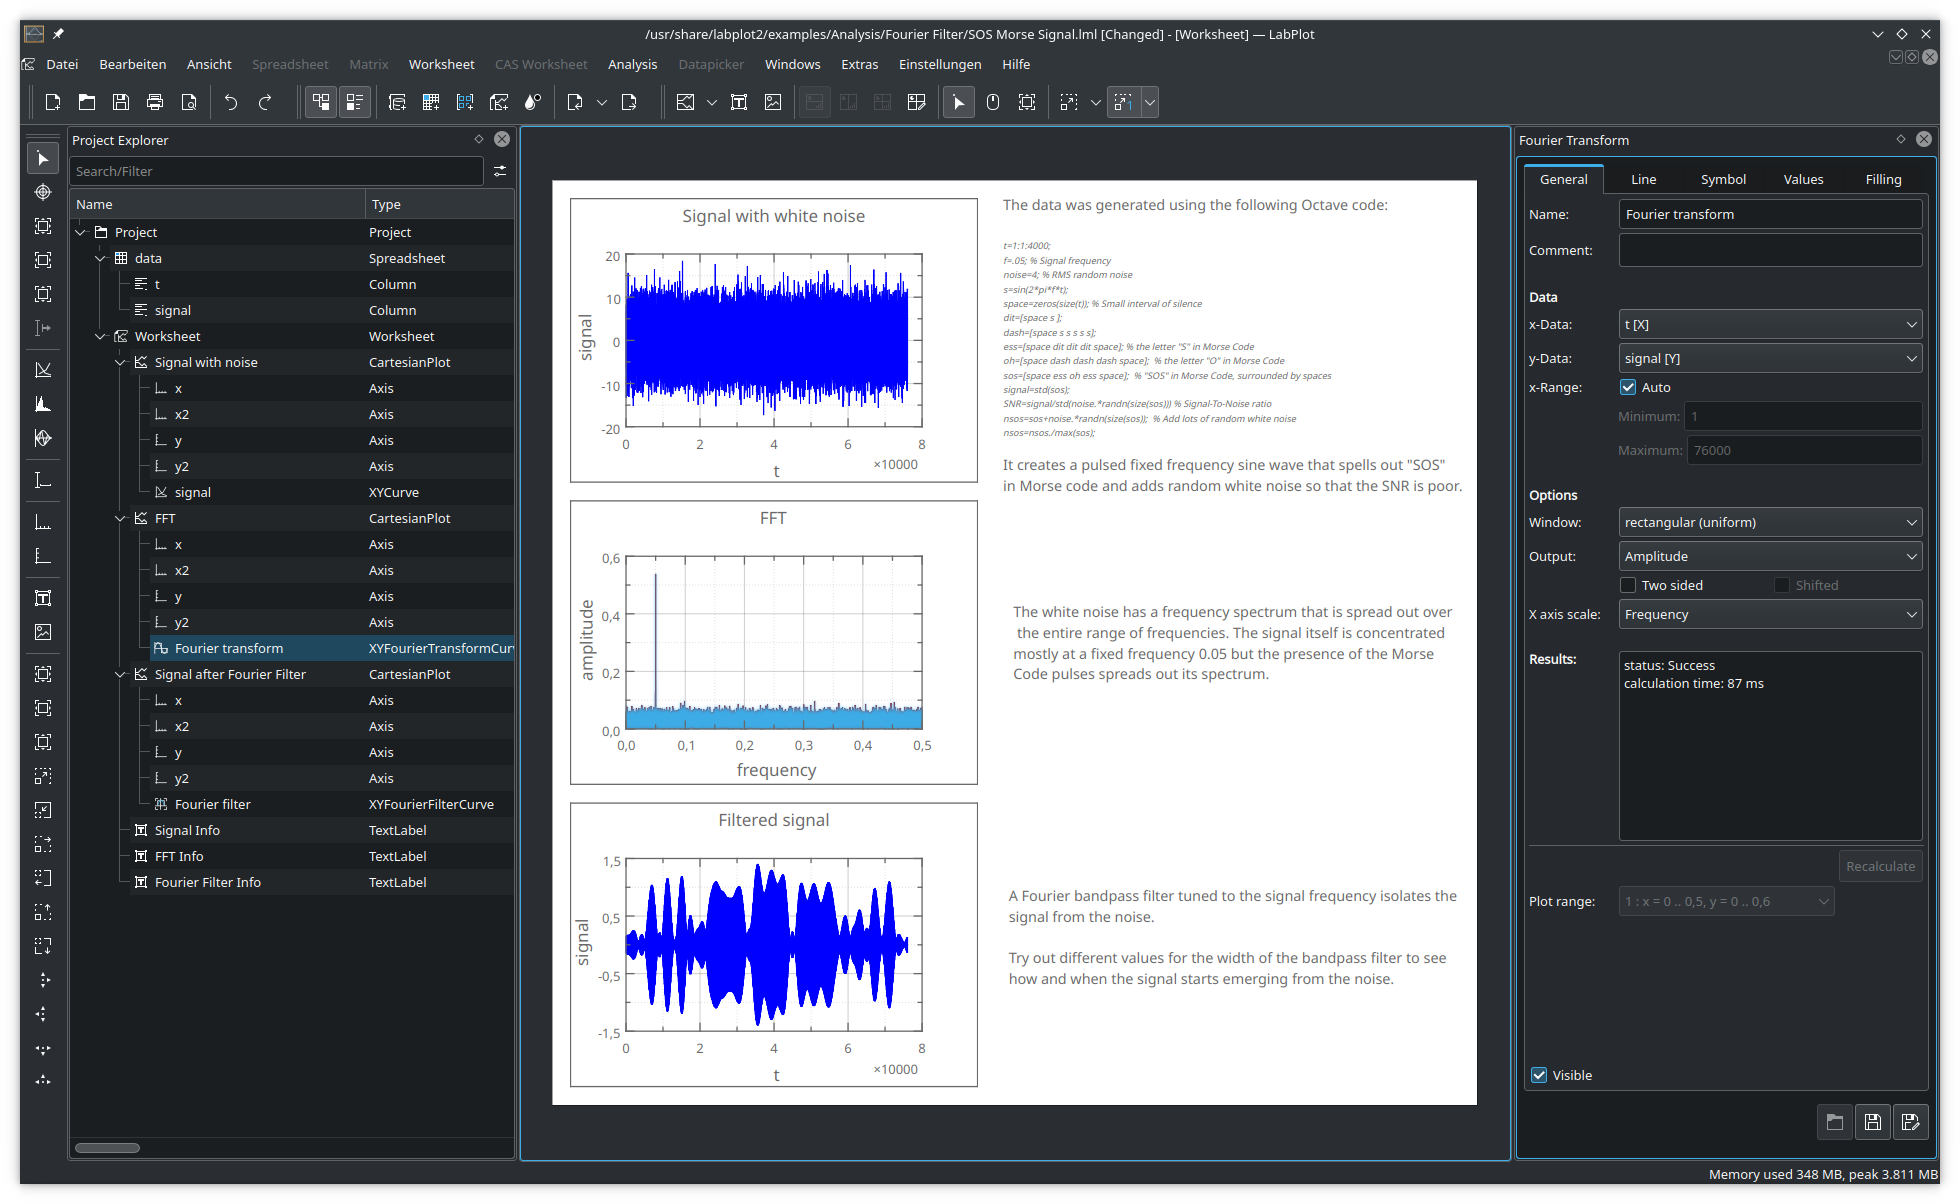
LabPlot is a FREE, open source and cross-platform Data Visualization and Analysis software accessible to everyone.

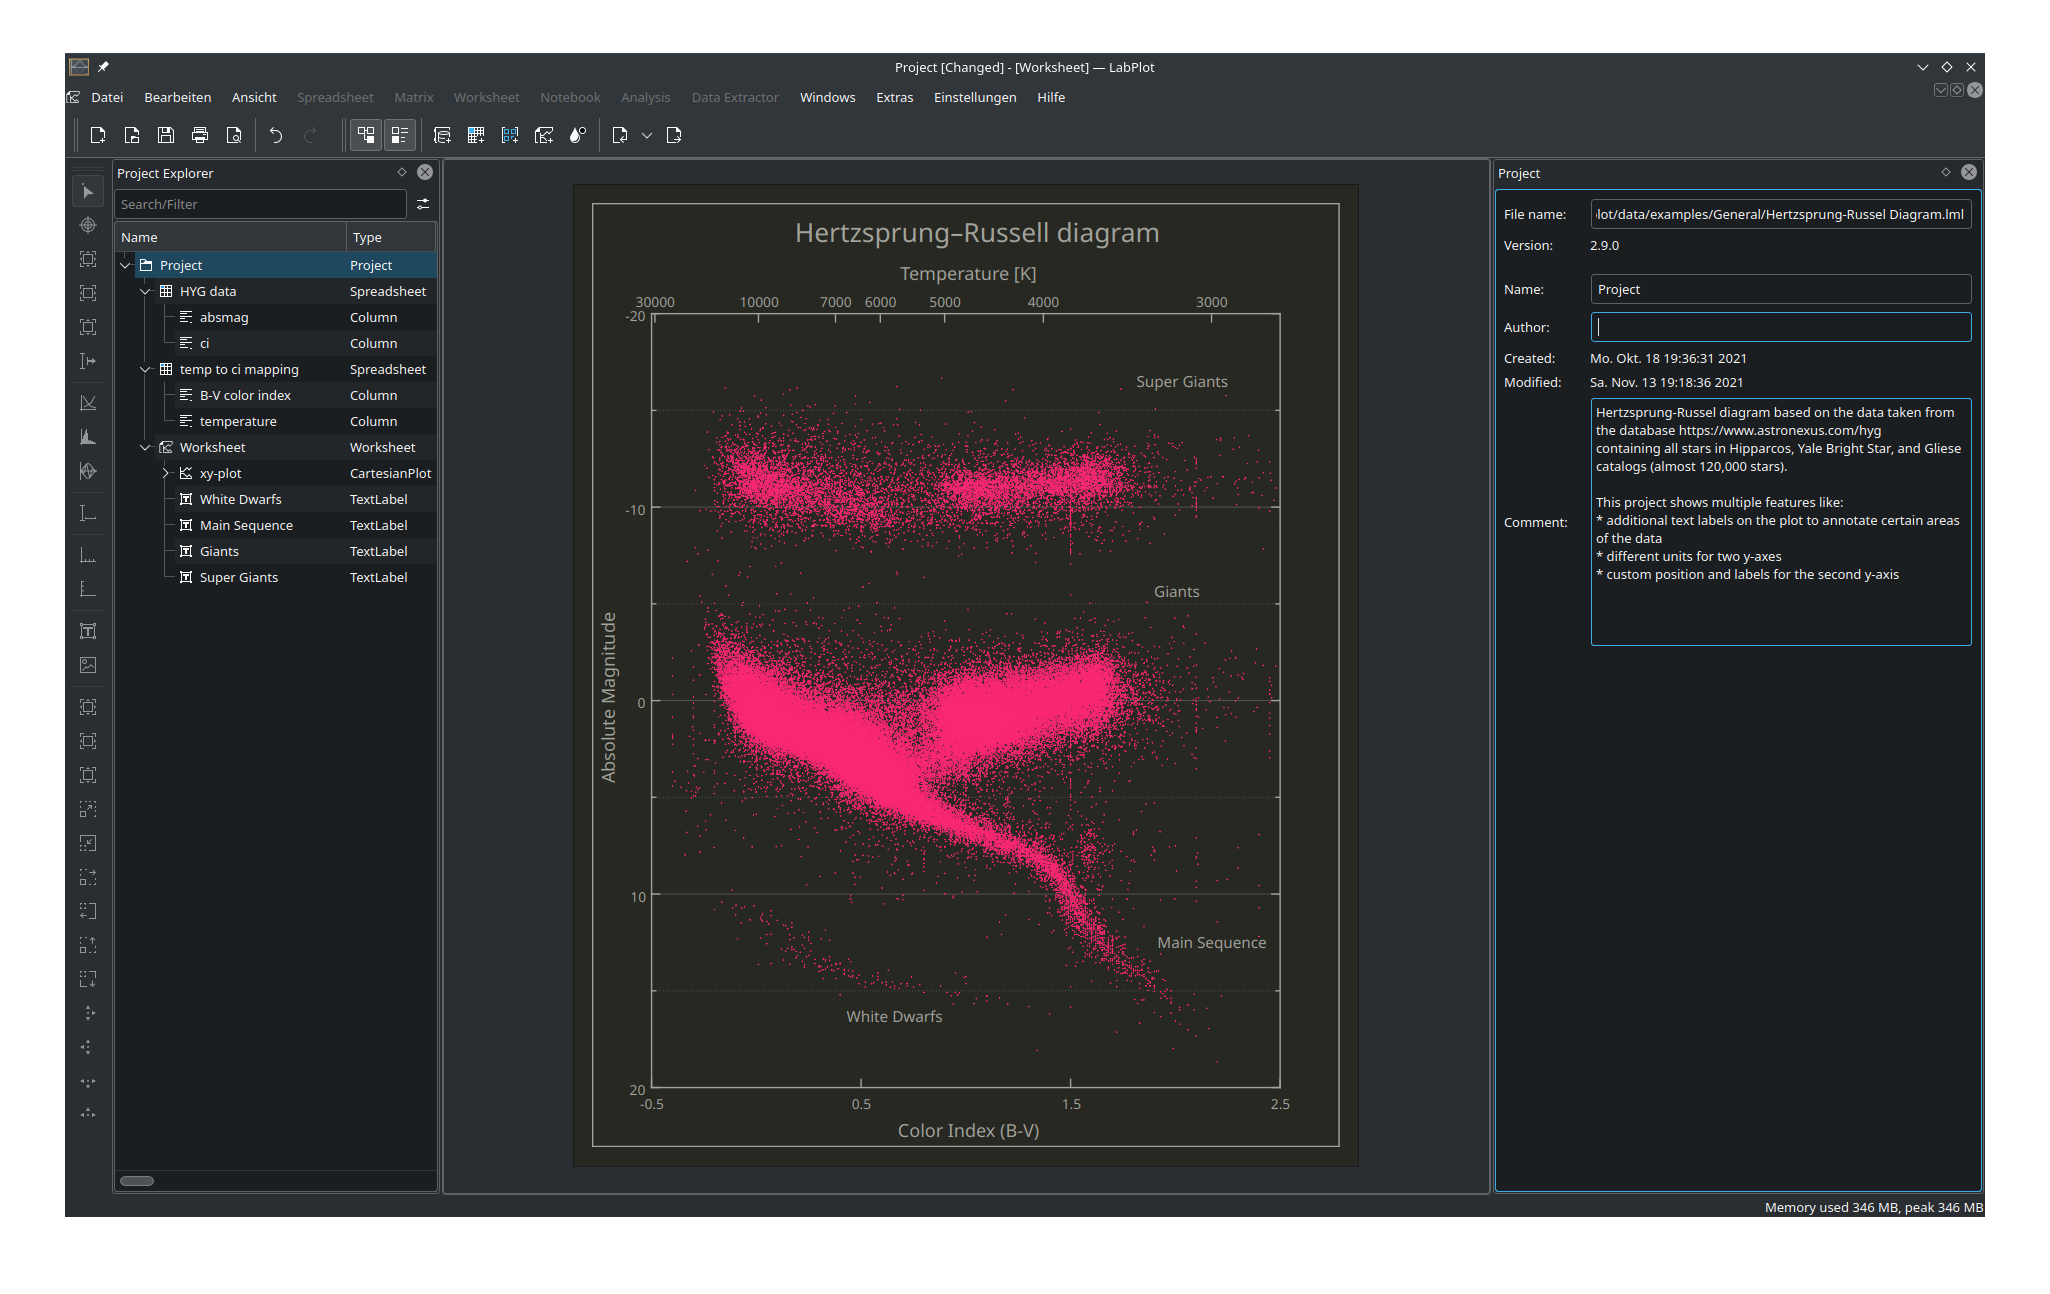
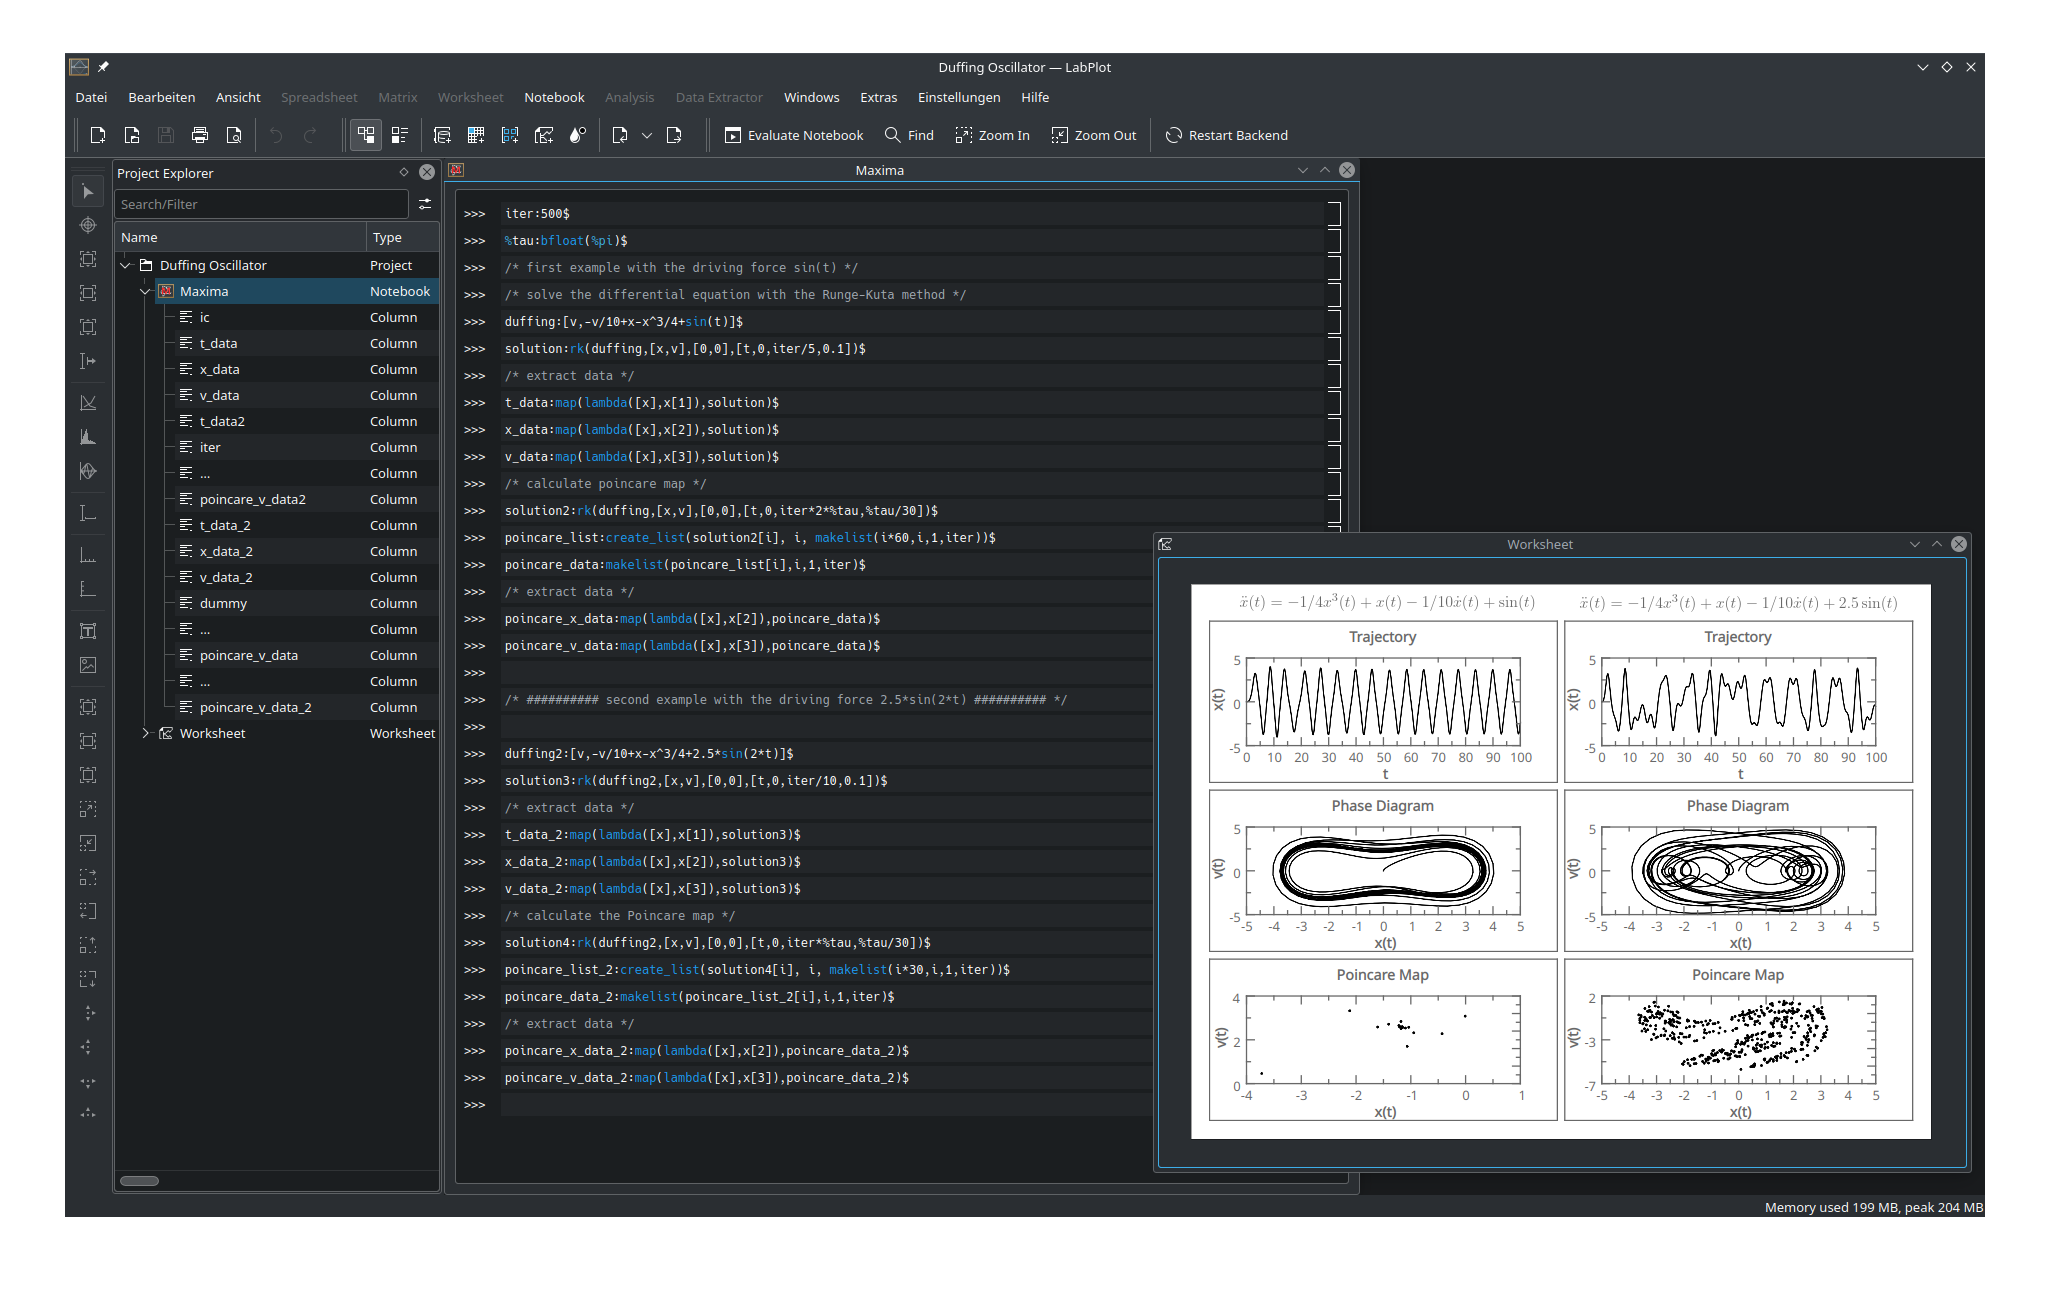
LabPlot provides an easy way to create, manage and edit plots. It allows you to produce plots based on data from a spreadsheet or on data imported from external files. Plots can be exported to several pixmap and vector graphic formats.

安装到
Linux
此按钮仅适用于 Discover 和其他 AppStream 应用程序商店。您也可以使用发行版的软件包管理器。
从 Microsoft 获取

软件版本 RSS

2.11.1 2024-07-16
2.11.0 2024-07-09
2.10.1 2023-07-11
2.10.0 2023-03-21
2.9.0 2022-05-03
2.8.2 2021-04-01
2.8.1 2020-11-13
2.8.0 2020-09-16

Nightly installers

LabPlot nightly installers are also available to download from the KDE CDN. These versions are intended for testing purpose. Get involved and help us make them better!

测试版本。

从最新版本的开发分支源代码构建。