
 教育
教育
 macOS
macOS
 Windows
 Basic visualization of data
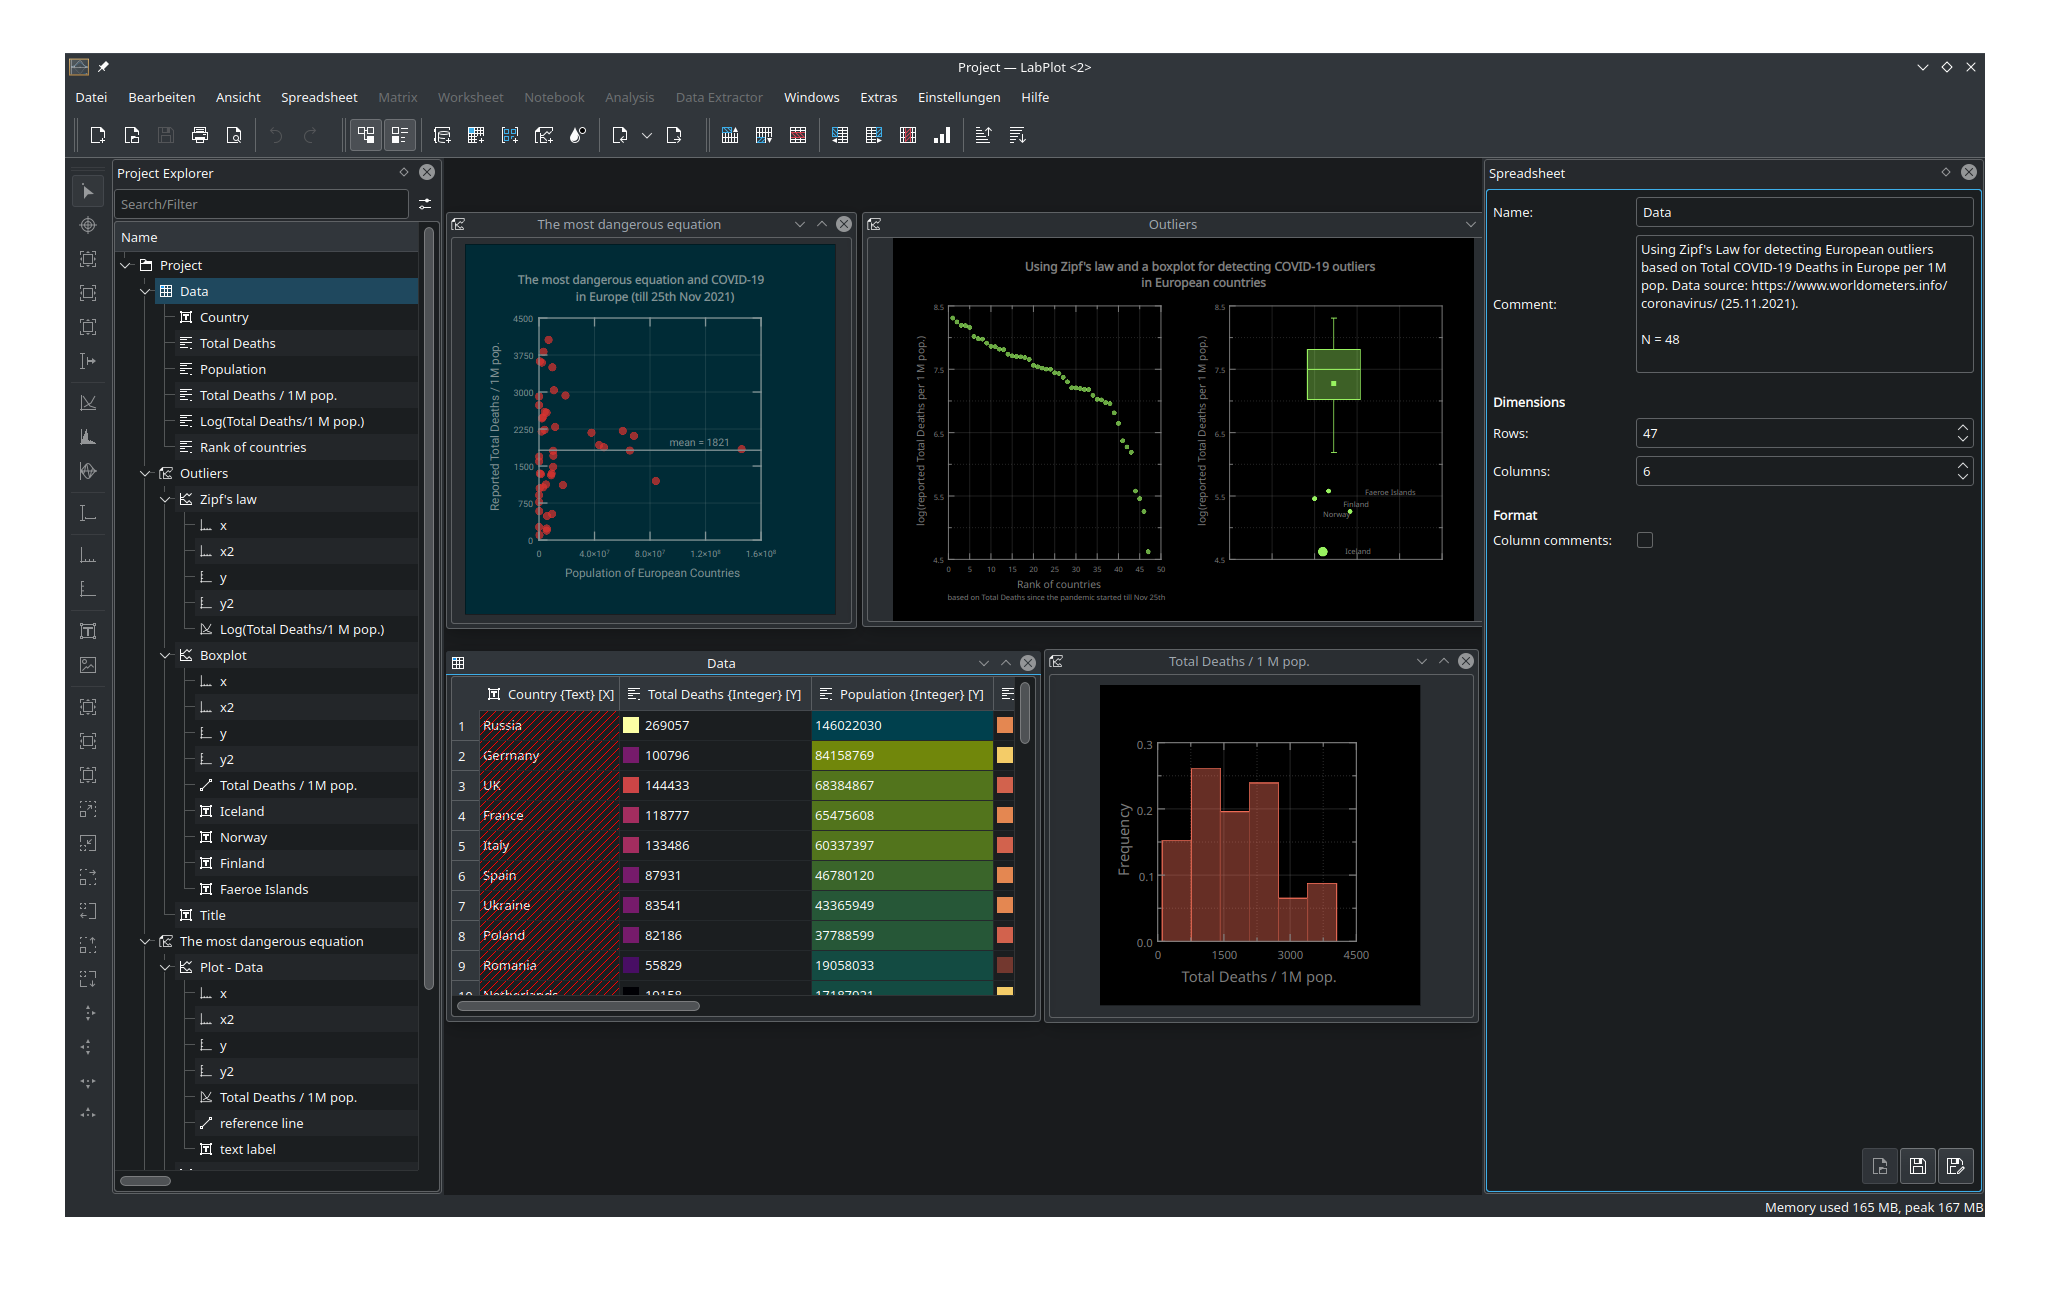 Basic visualization of data
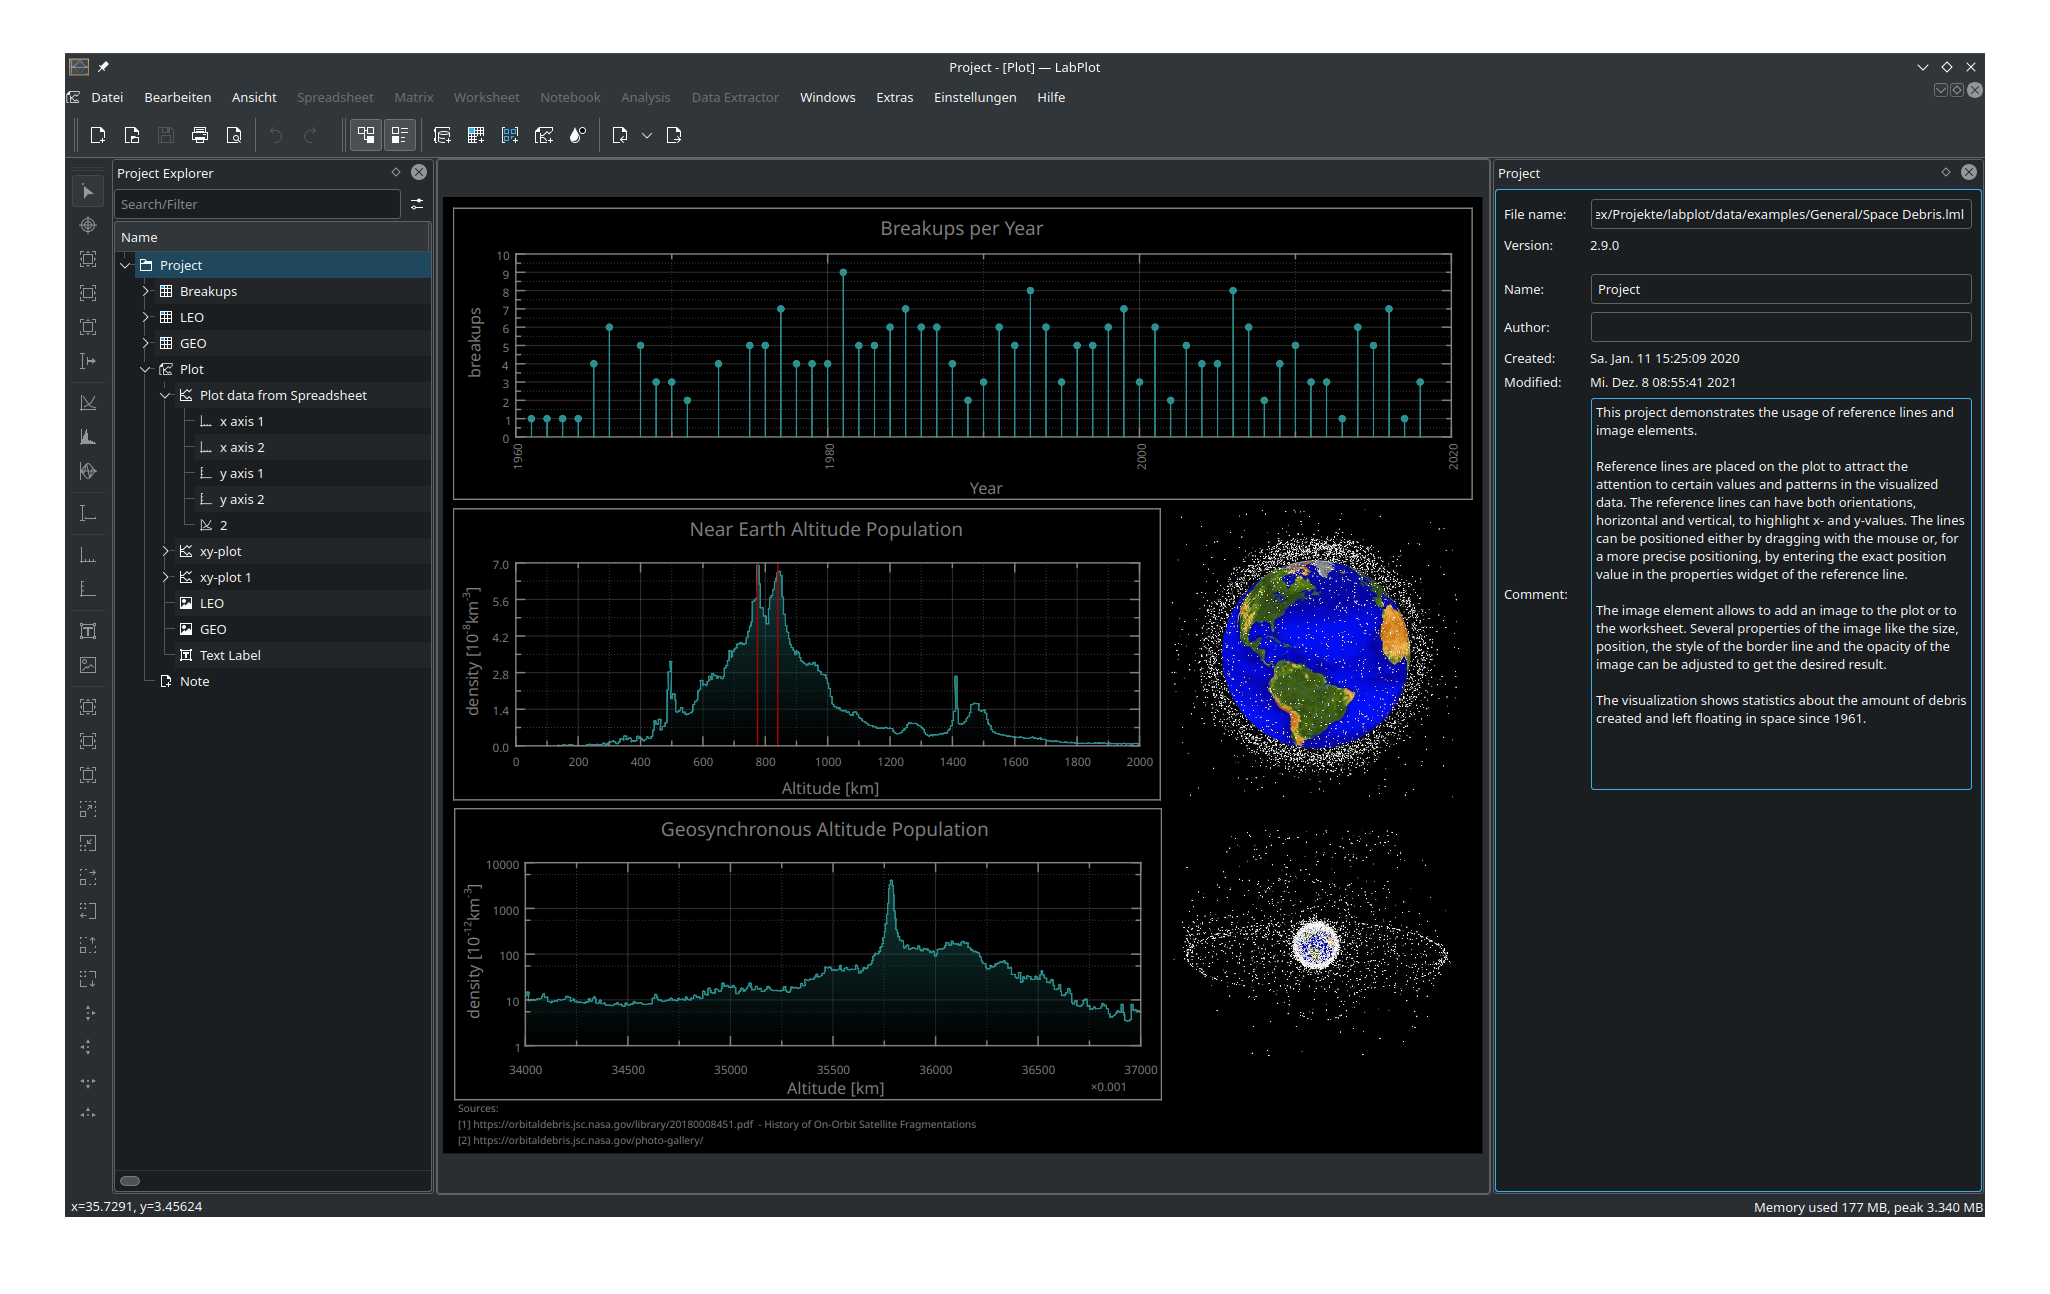 Advanced layouting of plots and images
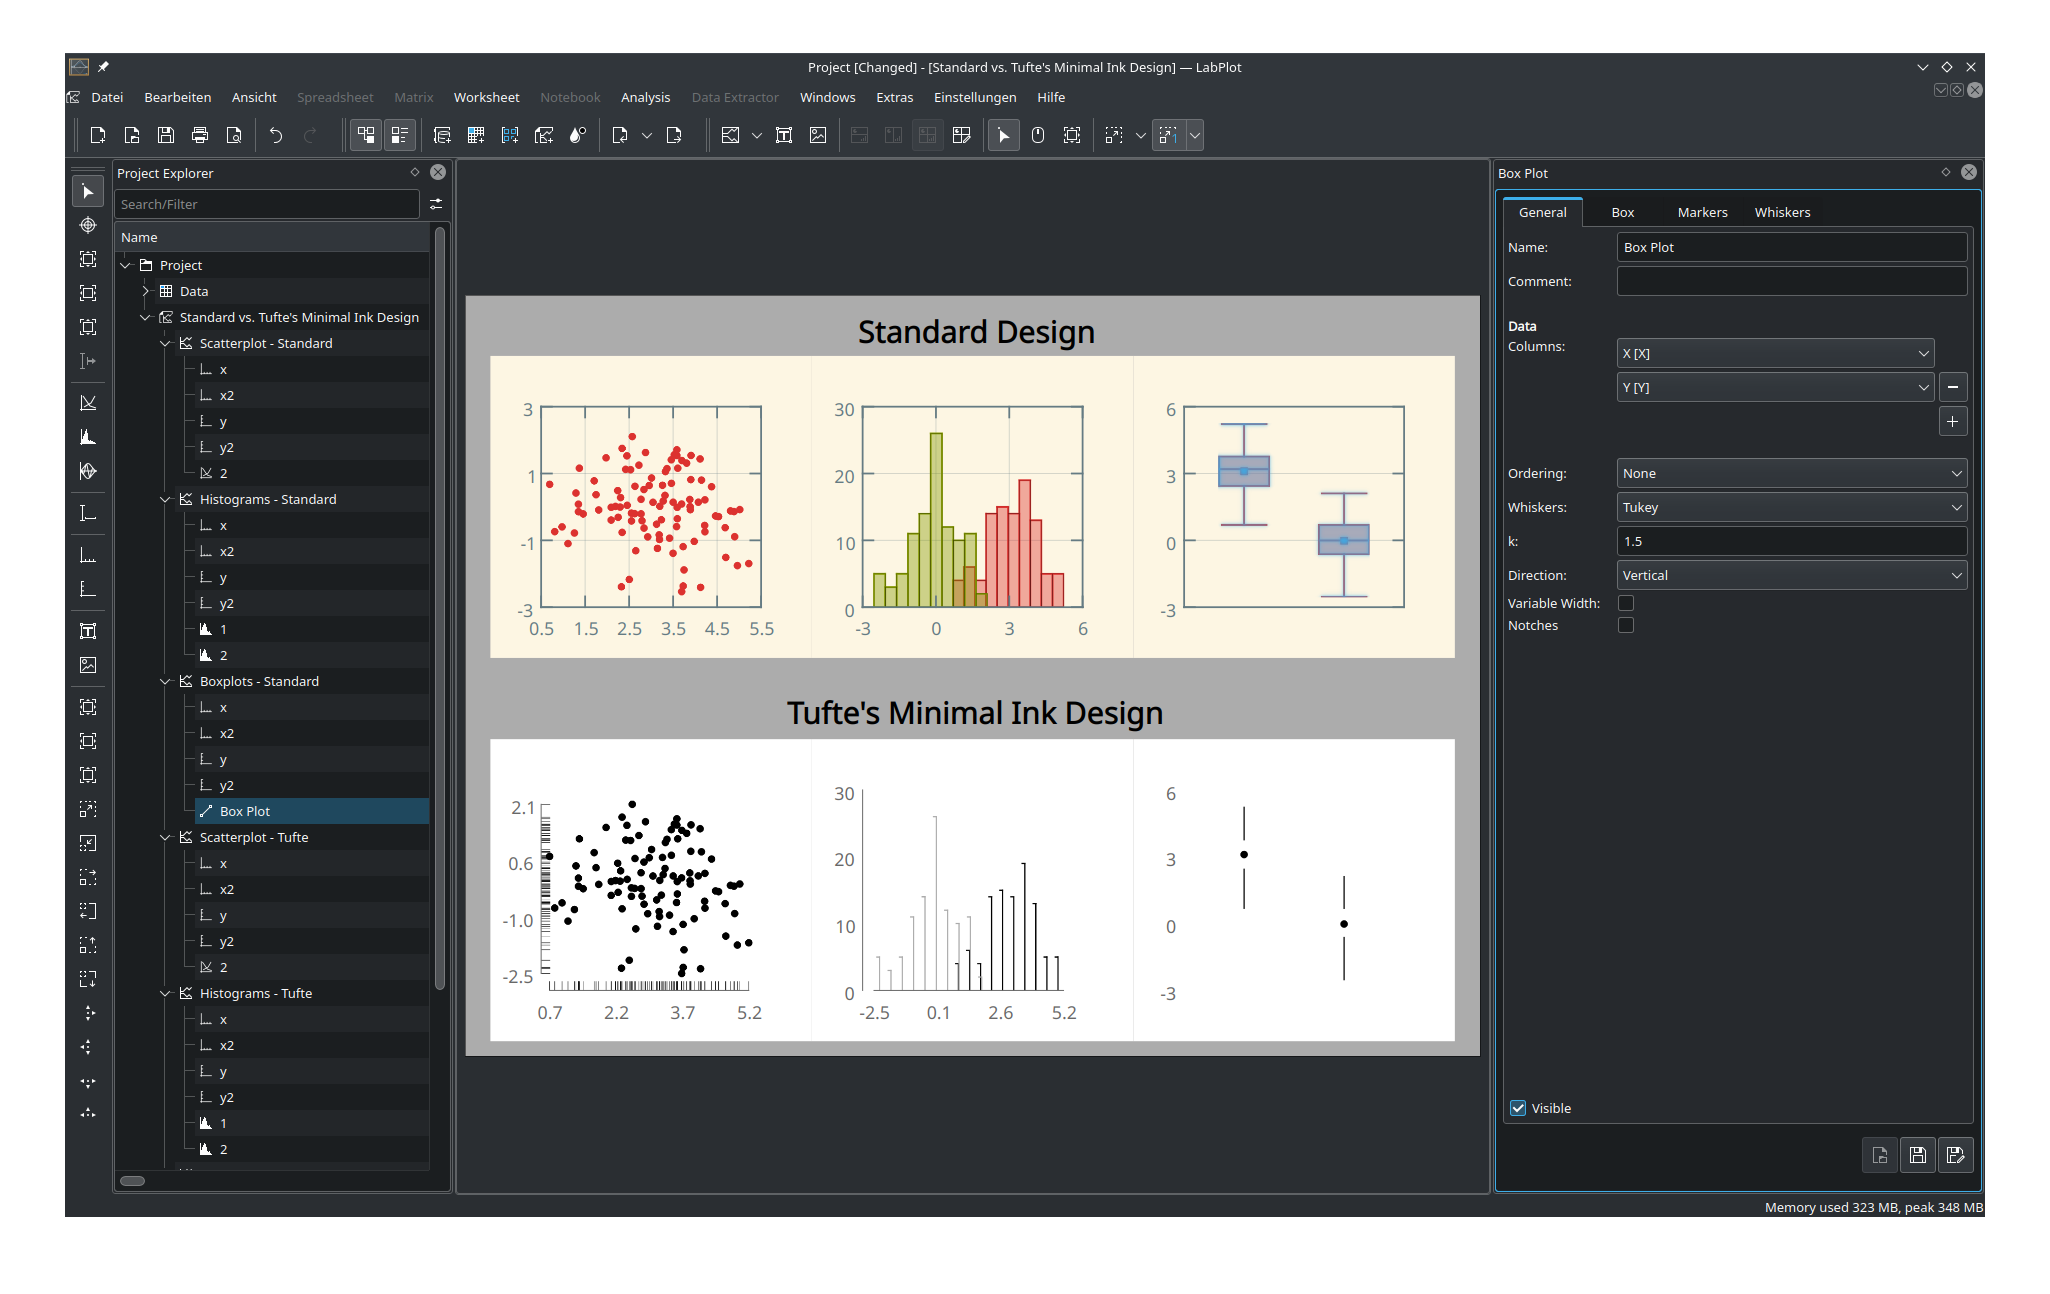 Theming
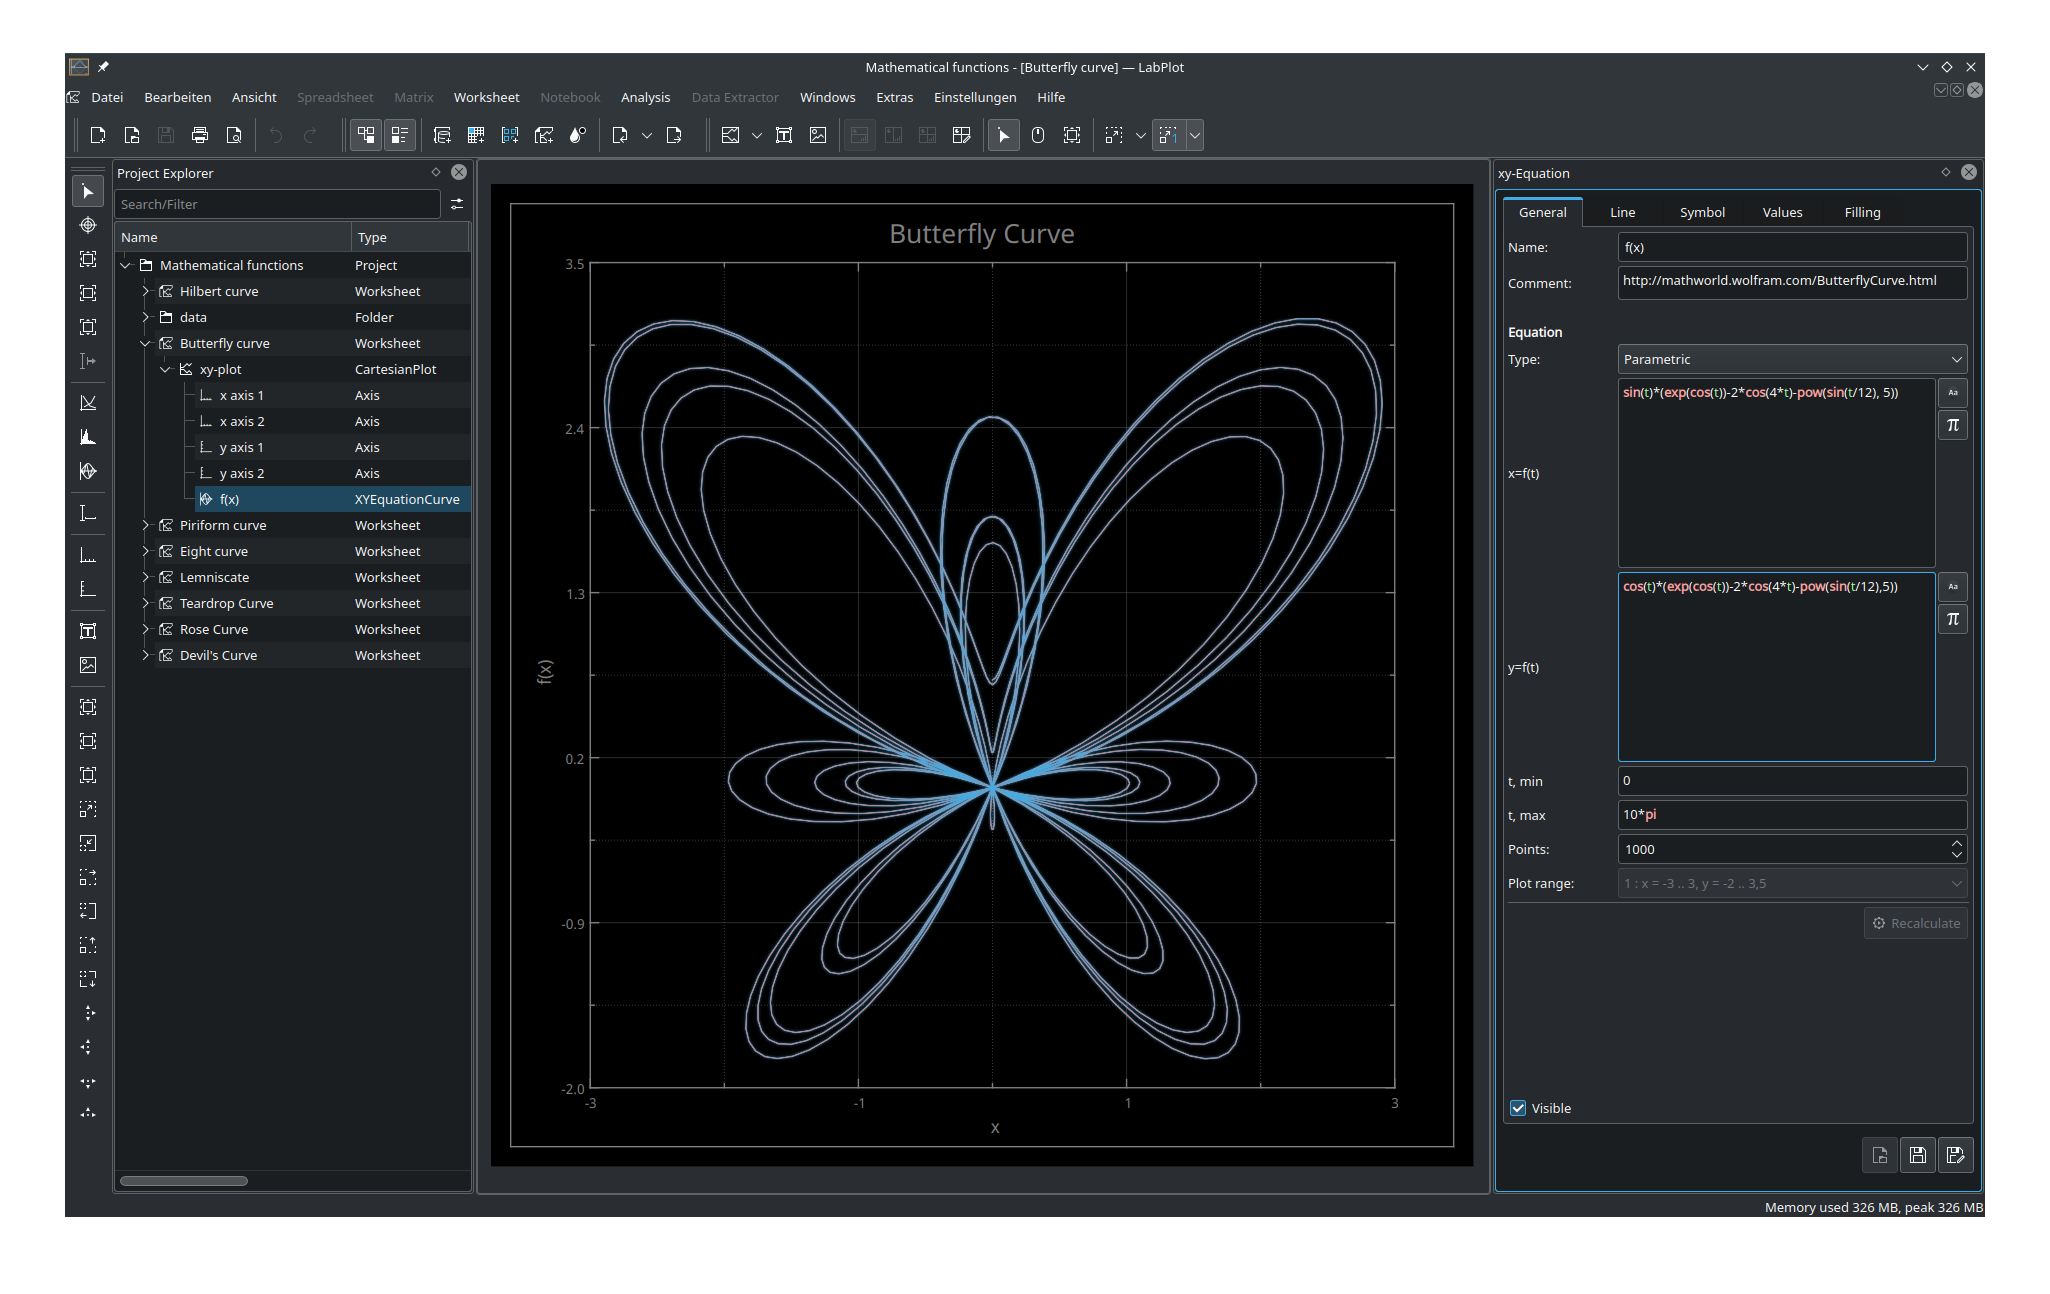 Visualization of mathematical functions
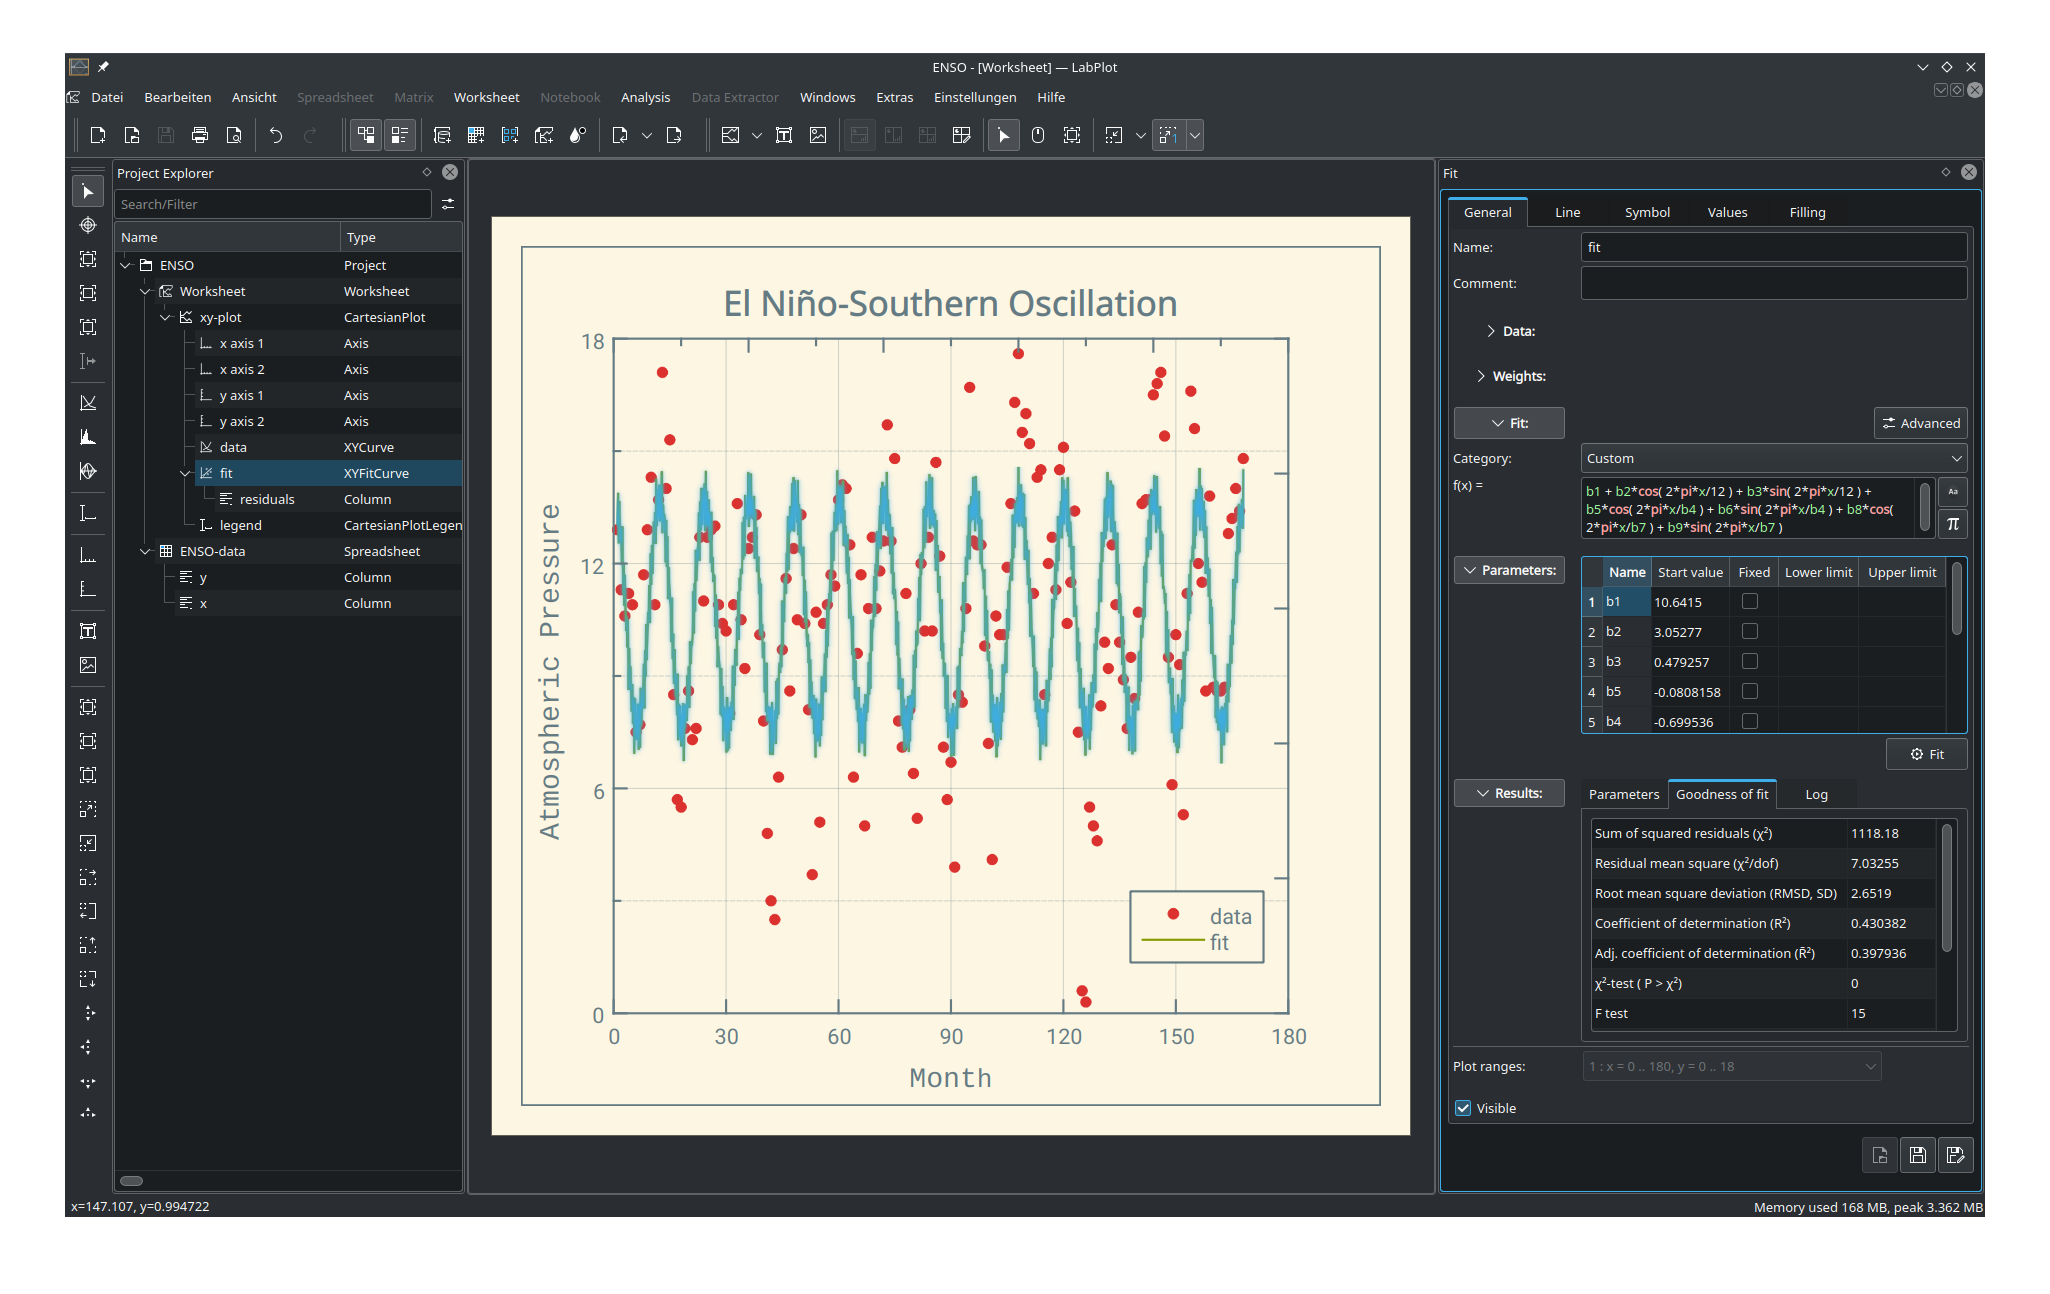 Fit pre-defined or custom models to the data
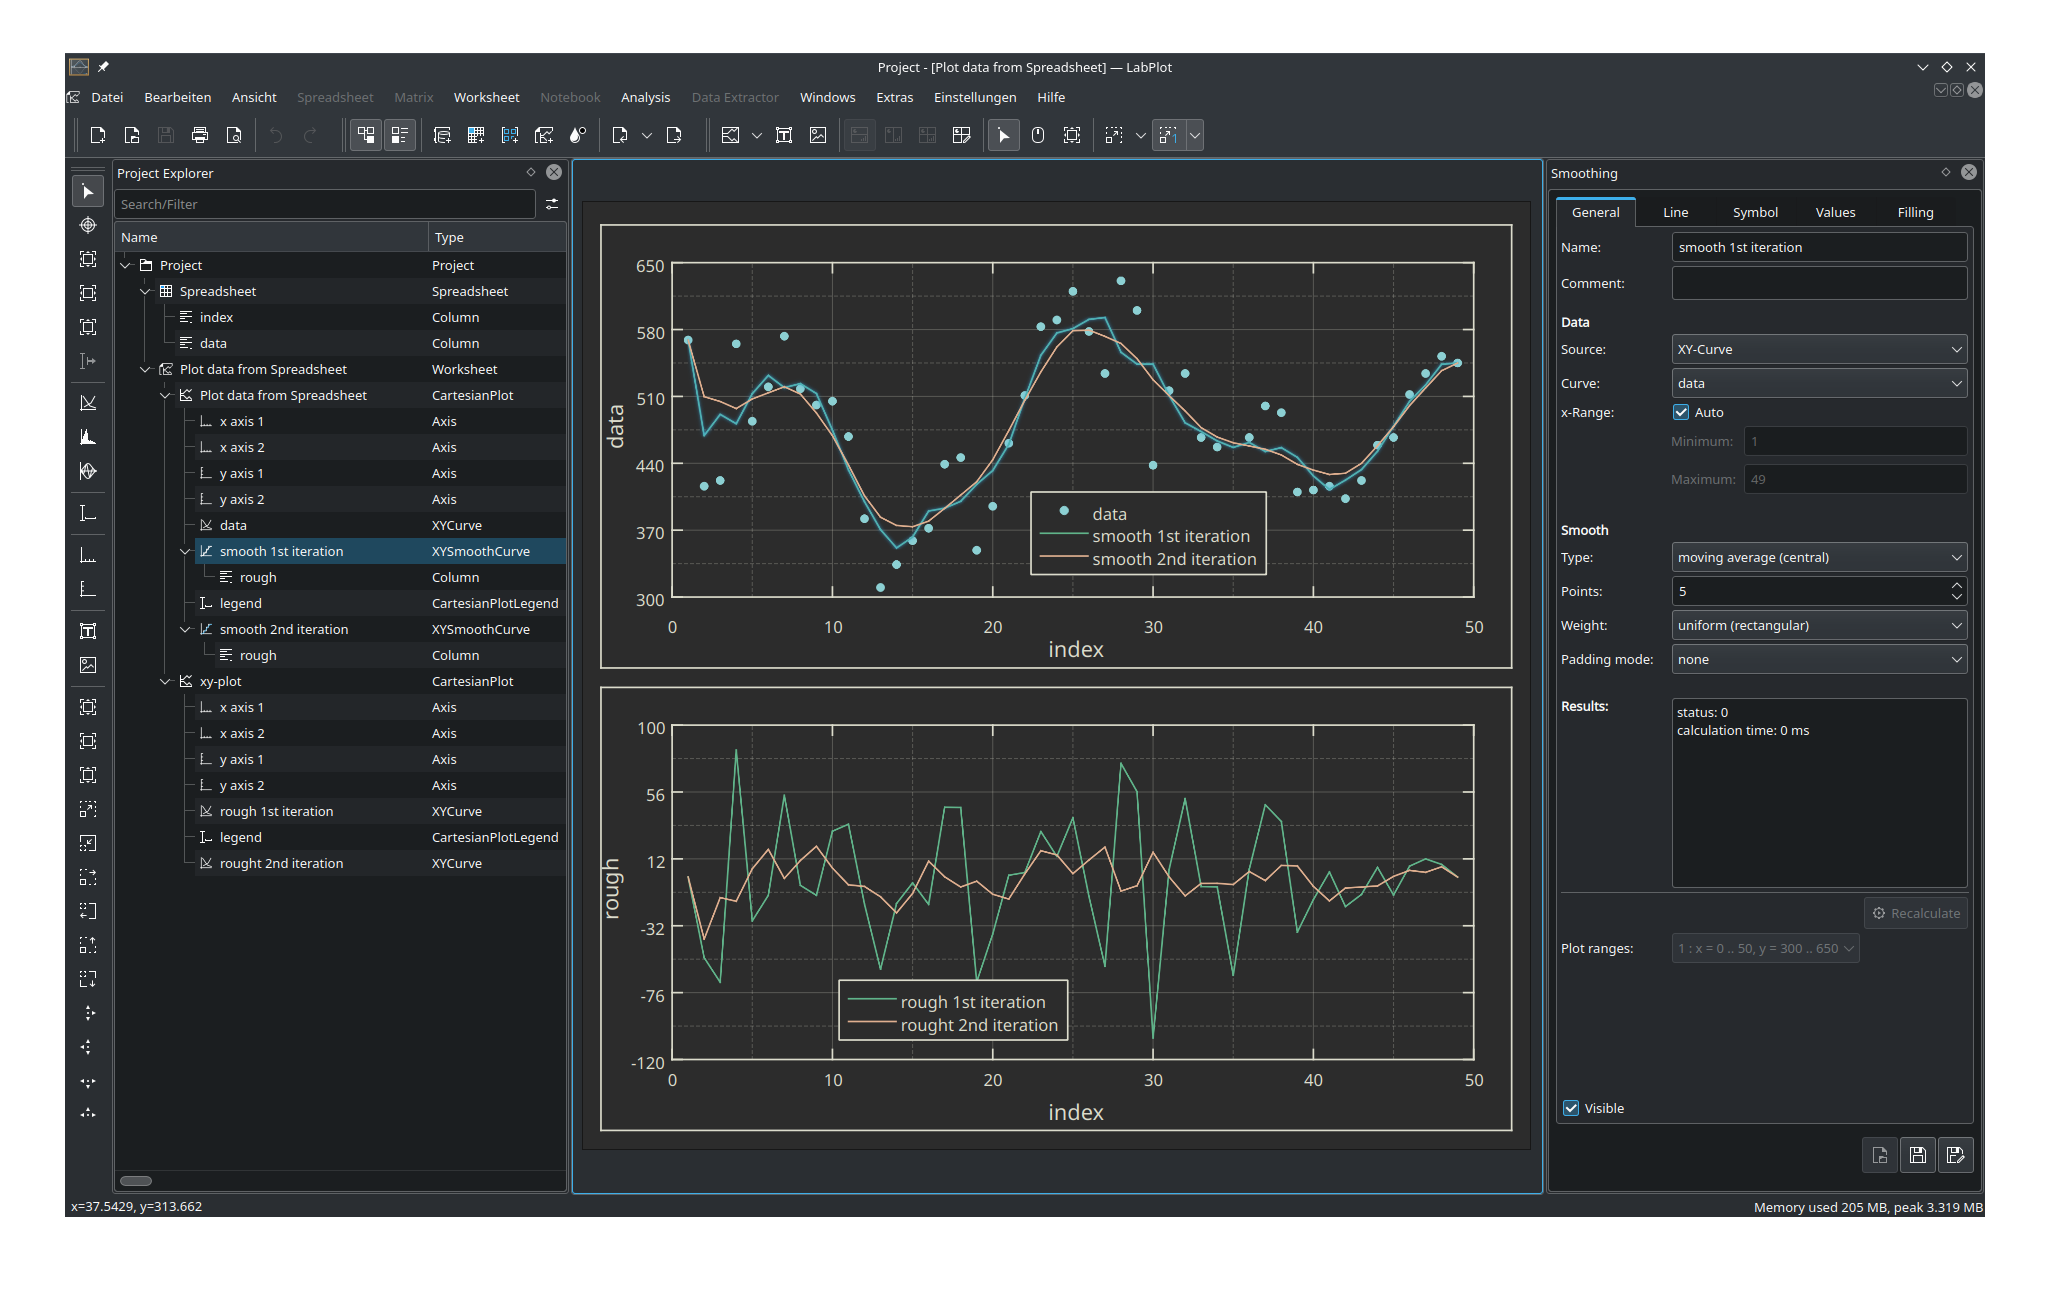 Smooth the data with the help of various smoothing methods
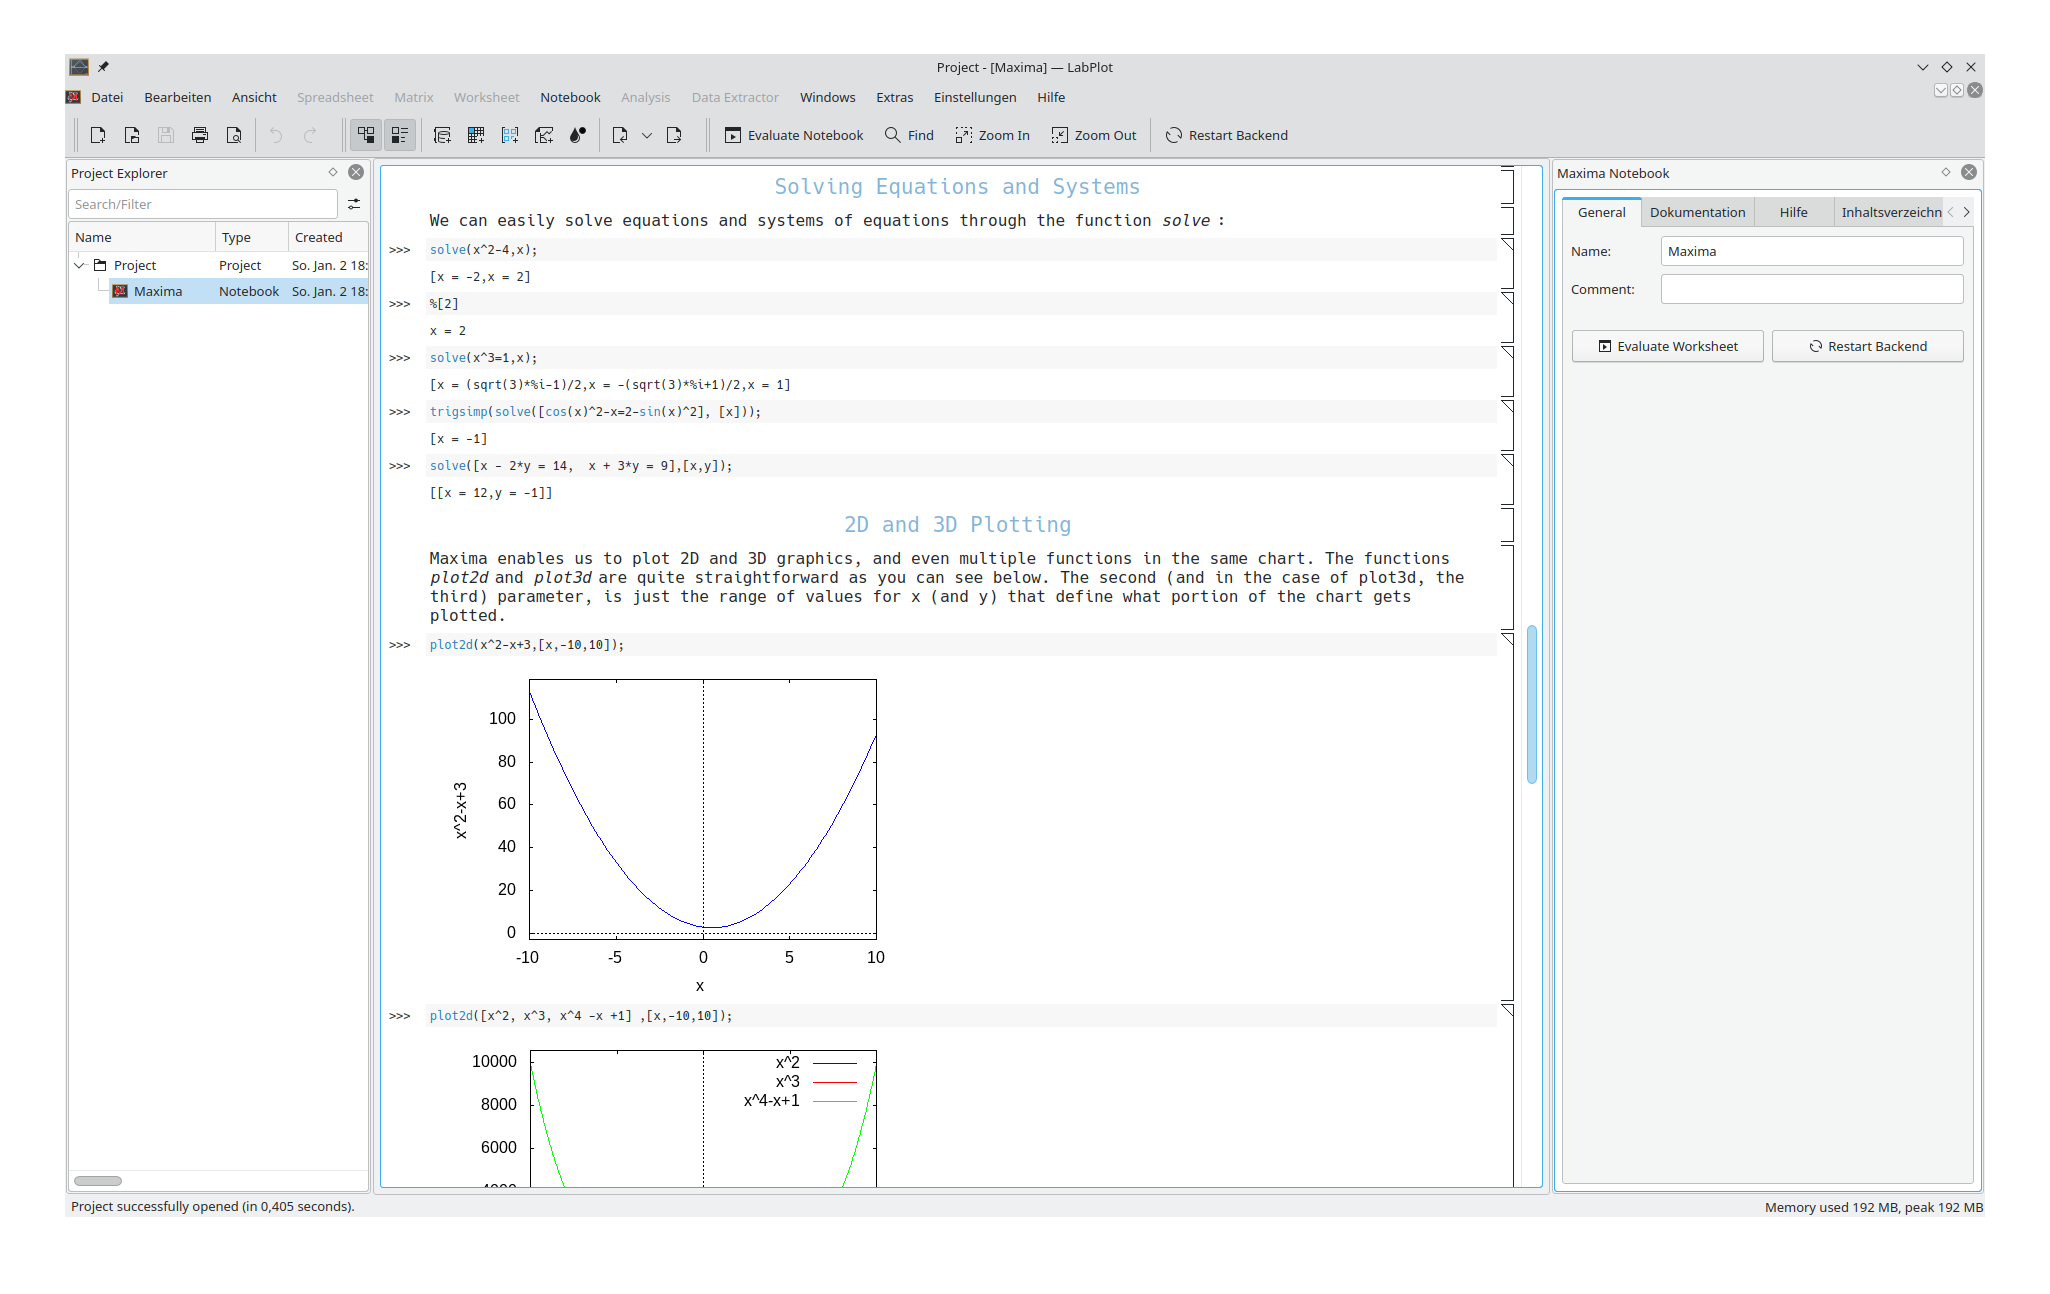 Notebook interface for interactive sessions in Maxima, Octave, R, Sage, Scilab, Python, Julia, etc
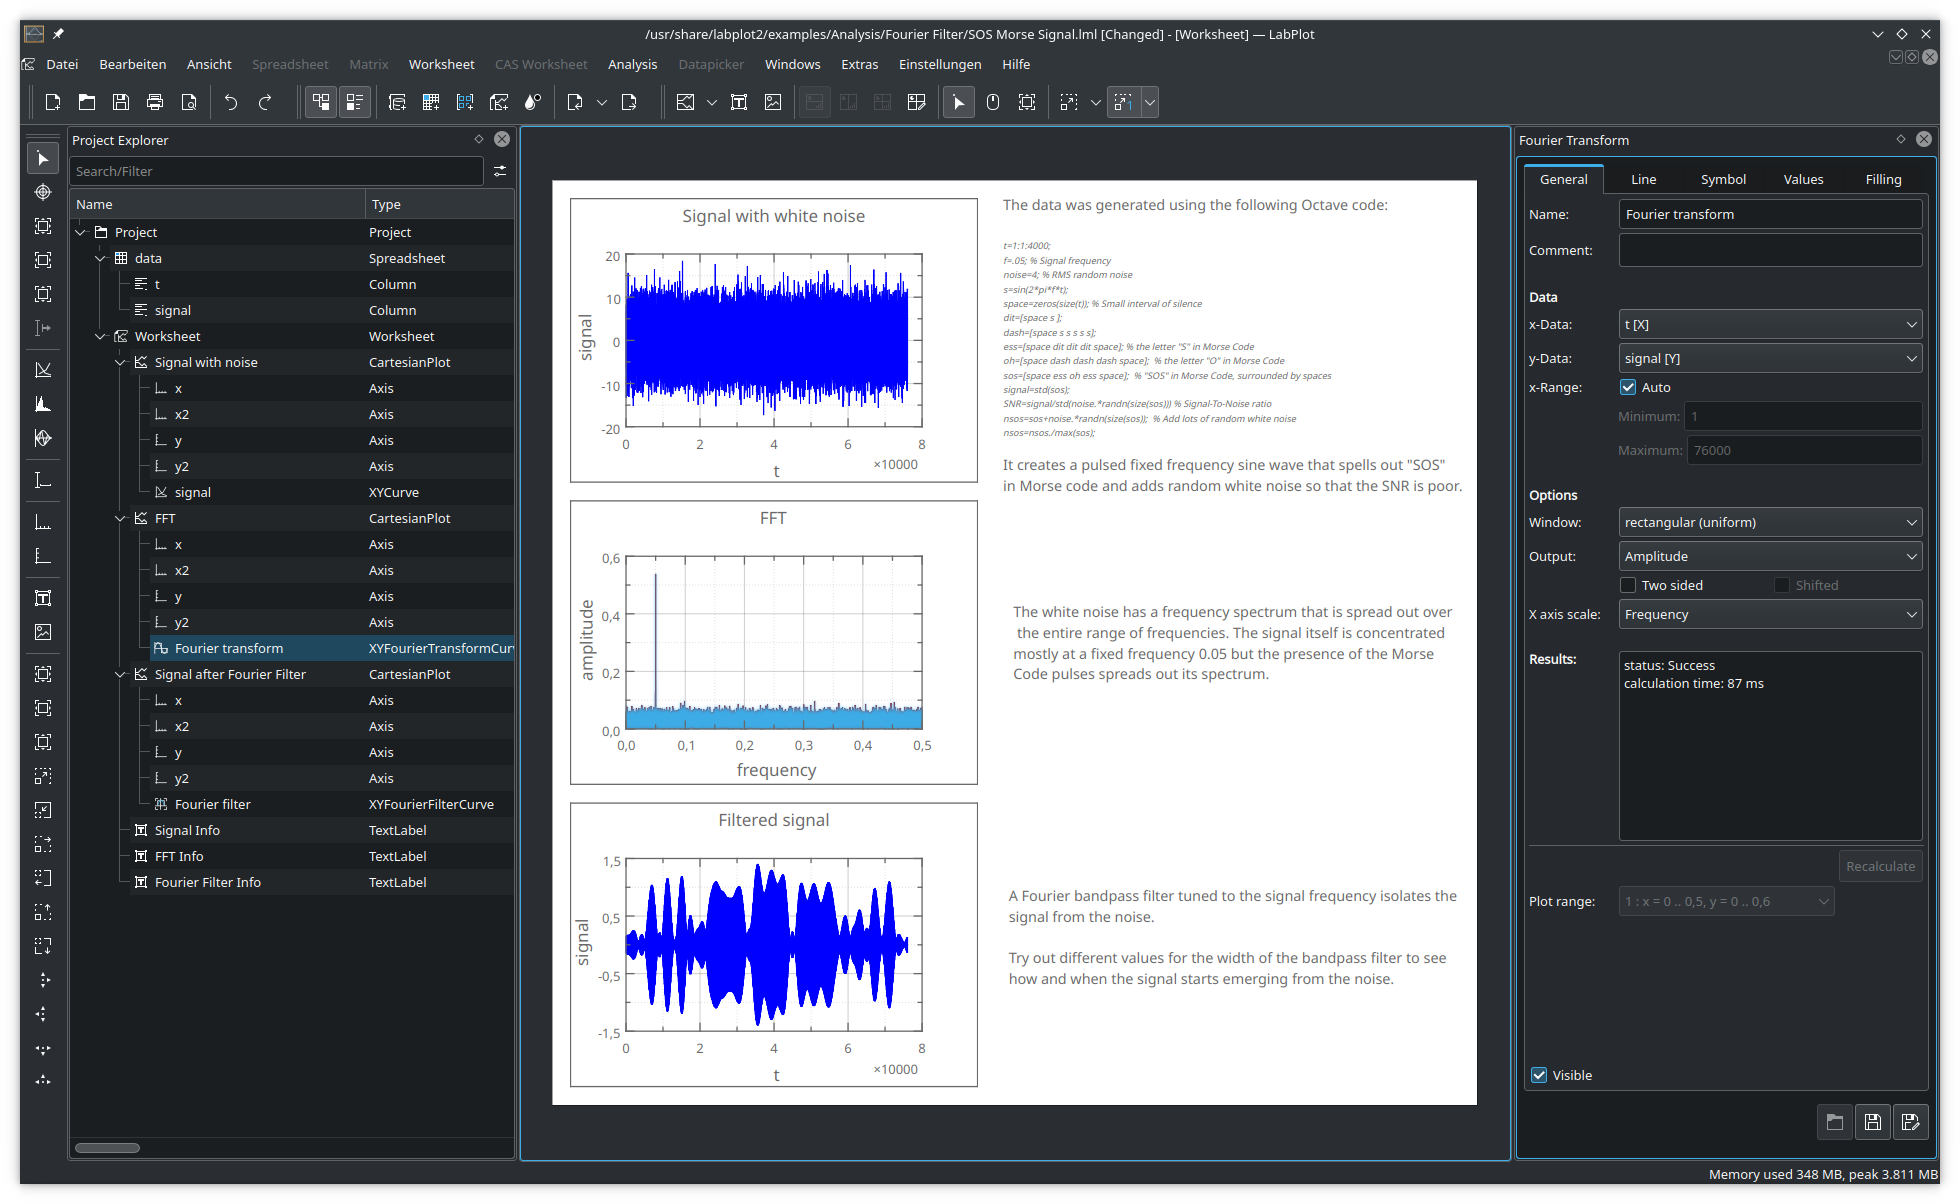 Signal analysis
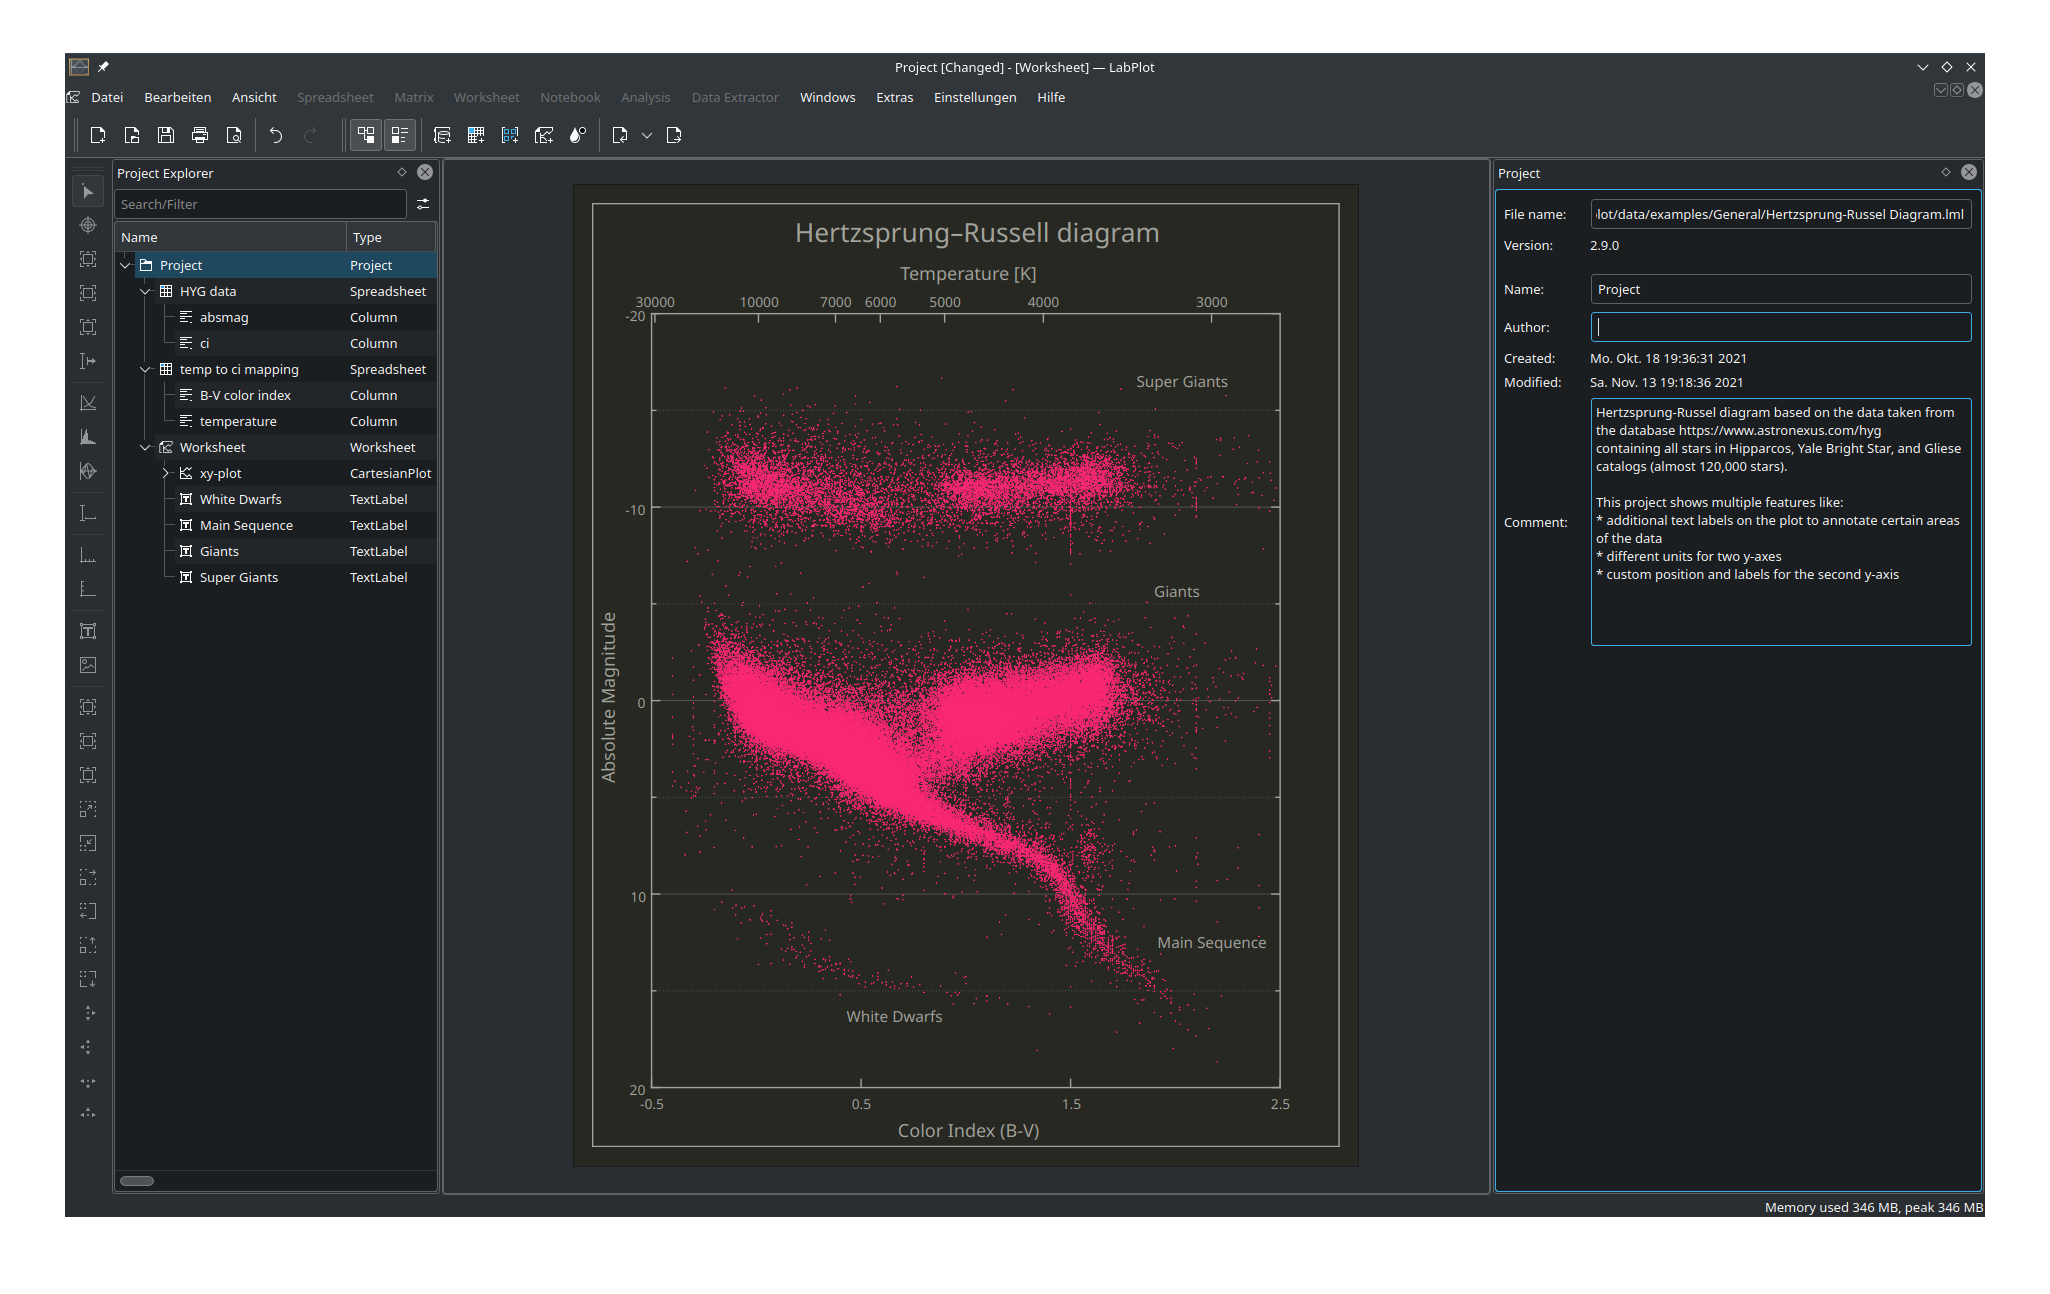 Herzsprung-Russel diagram in LabPlot
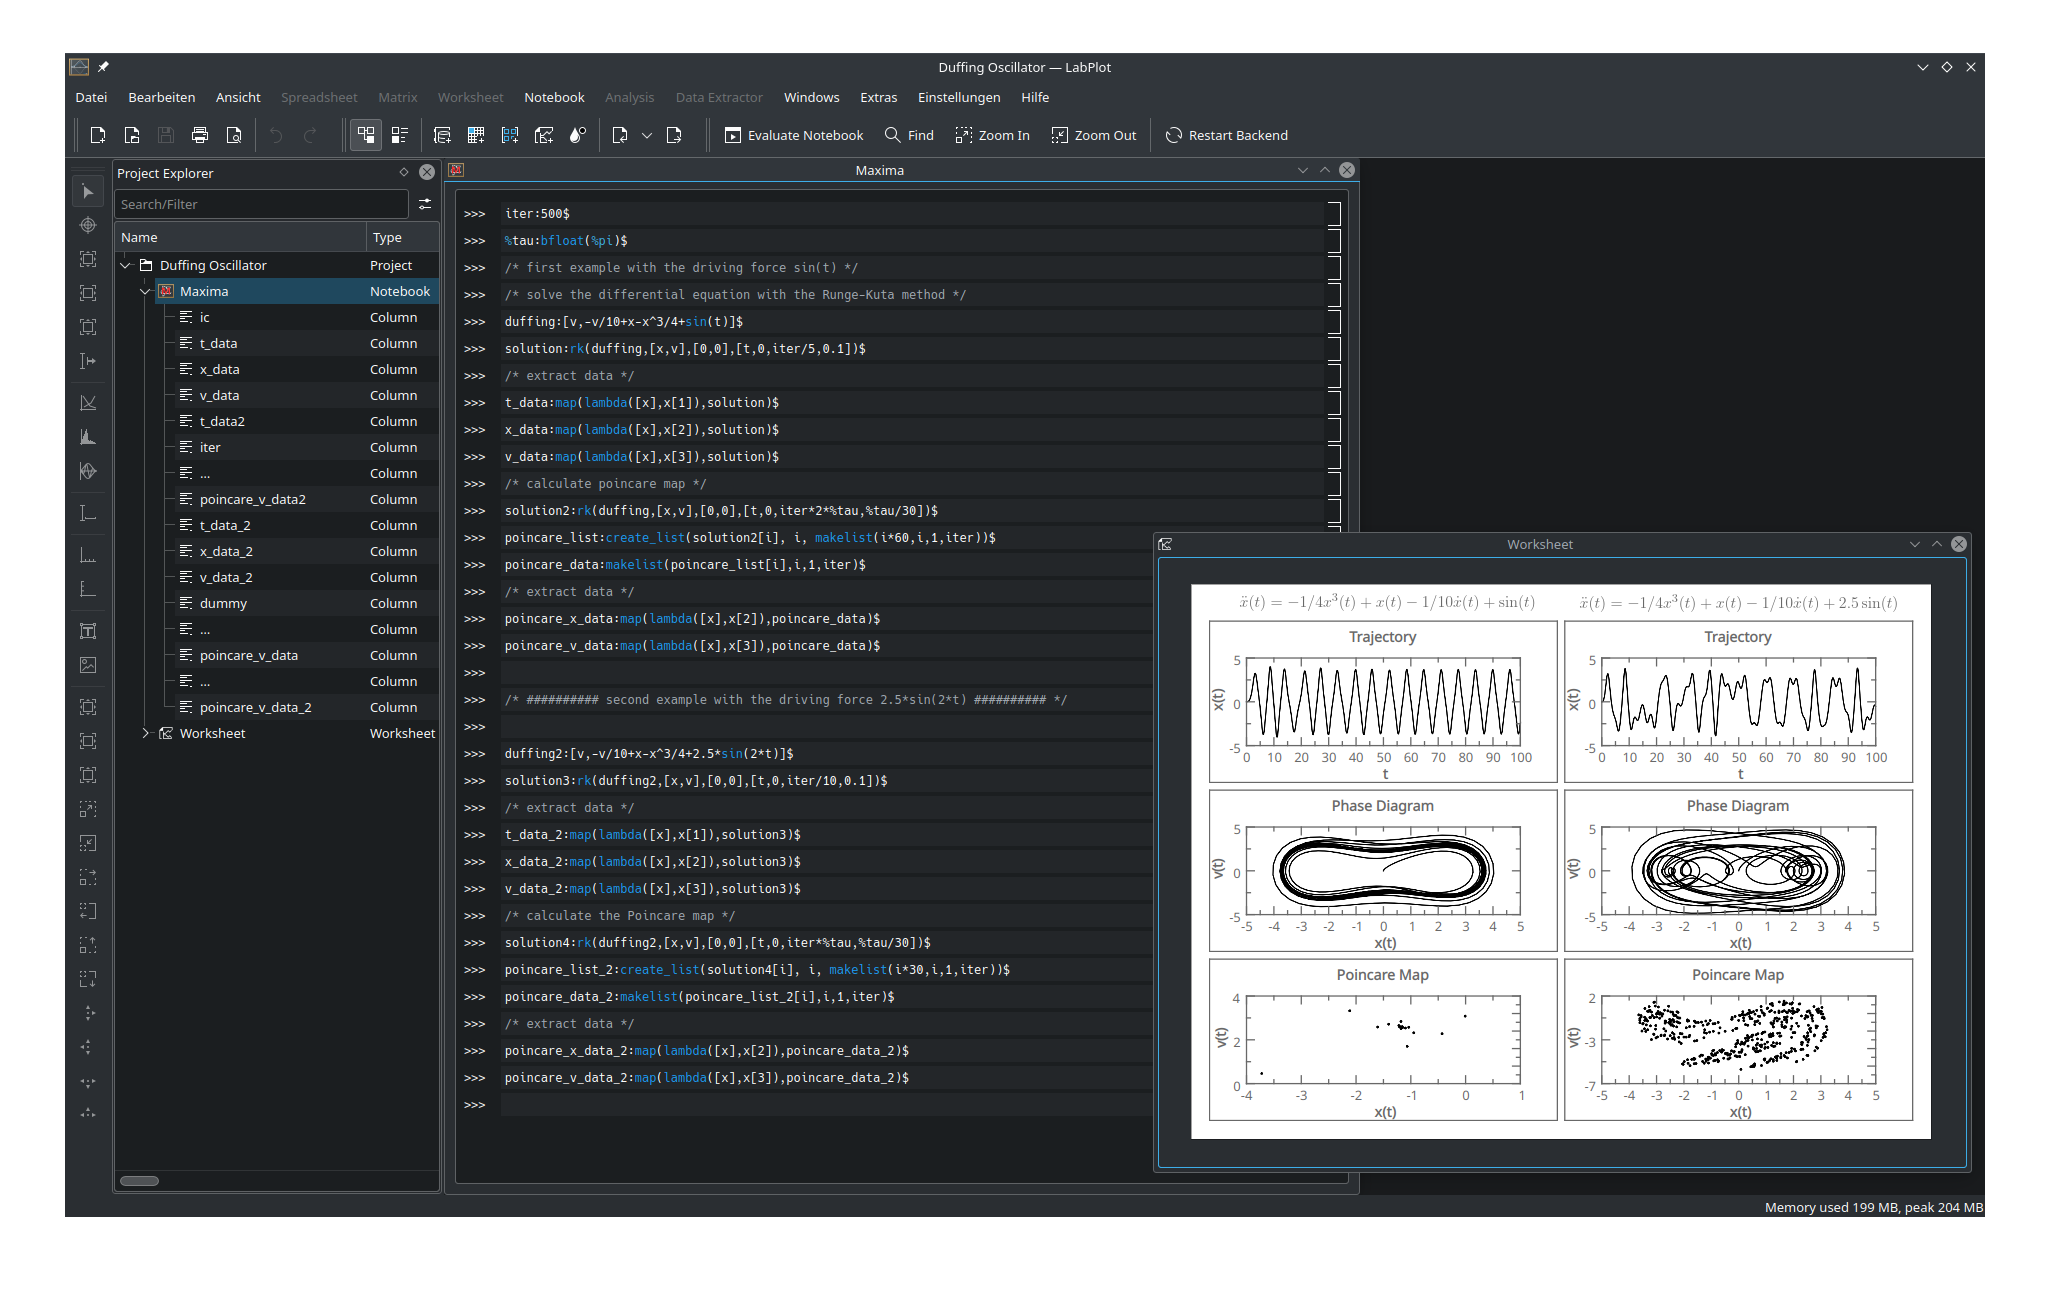 Visualization of data calculated in an interactive Maxima session
LabPlot is a FREE, open source and cross-platform Data Visualization and Analysis software accessible to everyone.
LabPlot provides an easy way to create, manage and edit plots. It allows you to produce plots based on data from a spreadsheet or on data imported from external files. Plots can be exported to several pixmap and vector graphic formats.



釋出版本 RSS
2.12.1
2025-08-15
2.12.0
2025-04-25
2.11.1
2024-07-16
2.11.0
2024-07-09
2.10.1
2023-07-11
2.10.0
2023-03-21
2.9.0
2022-05-03
2.8.2
2021-04-01
2.8.1
2020-11-13
2.8.0
2020-09-16
Nightly 測試版安裝程式
LabPlot 的 Nightly 測試版安裝程式也可以從 KDE 的 CDN 下載。這些版本主要是用來測試的。參與開發來幫我們改善它們!
不穩定版。
從開發分支的最新版產生。
- Linux (AppImage)
- Flatpak
下載 flatpakref 檔案然後用您的軟體中心來開啟它來進行安裝,或是在終端機執行以下指令:
flatpak install --user --or-update https://cdn.kde.org/flatpak/labplot-nightly/org.kde.labplot.flatpakref - Windows
- macOS ARM
- macOS Intel